Big Data analysis using AWS RDS, AWS S3, Google Colab Notebook, PySpark, PostgreSQL/pgAdmin, and SQL

This project examines Amazon reviews written by members of the paid Amazon Vine program, a service that allows manufacturers and publishers to receive reviews of their products.
Our goal was to determine if there is a bias towards 5 star ratings of products provided to Vine members vs. non-members. For example, if a Vine member is asked to publish a review on Amazon in exchange for a free product, will they be more inclined to provide a 5 star rating?
I was able to use PySpark and Pandas to extract, transform, and load (ETL) the data to a AWS RDS I created and connected it to my PostgreSQL server to be able to query it and extract my finished tables.
The objective of this project was to familiarize myself with PySpark. Apache Spark is a unified analytics engine for large-sacale data processing. This means that when working with big data, Spark is one of the best technologies out there because of its in-memory computation instead of disk-based solution. It allows for lazy evaluation and delaying expressions or commands until its needed.
In total there were 50 datasets to complete this analysis and I chose the "Pet_Products" dataset.
Our analysis was performed by extrating the Pet_Products Amazon review dataset, transforming it into a DataFrame, and calculating the percentage of 5 star ratings to total ratings. Throughout this analysis we used:
PySparkto extract the dataset, transform/filter the data, connect to aAWS RDSinstance and uplaod transformed data intopgAdmin.Google Colaboratoryto importPySparklibraries, establish a connection toPostgres, and createSQLtables to hold the exported results.
Datasets used for this analysis can be found here
To provide a more clear picture, we filtered the dataset by:
- Count of total_votes equal to or greater than 20.
- Percent of helpful_votes to total_votes equal to or greater than 50%.
By filtering the dataset, we created a more focused sample of the data which allowed us to address the following questions:
- How many Vine reivews and non-Vine reviews were there?
- There were 170 Vine Reivews and 37,840 non-Vine reviews.
- How many Vine reviews were 5 stars? How many non-Vine reviews were 5 stars?
- Vine members gave 65 out of 170 reviews a 5 star rating.
- Non-Vine members gave 20,612 out of 37,840 reivews a 5 star rating.
- What percentage of Vine reviews were 5 stars? What percentage of non-Vine reviews were 5 stars?
- 38.23% of Vine member reviews were 5 stars.
- 54.47% of non-Vine member reviews were 5 stars.
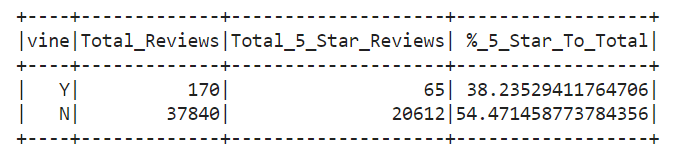
Our results suggested that Vine members did not show bias when rating their products. Considering that a much larger percentage of non-Vine members (54.47%) gave these products 5 stars incomparison to Vine members (38.23%) we can assume Vine members were more critical of the products they were reviewing.
Additional analysis should be made on other categorical datasets to further support our assumption. Repeating this analysis on 5 separate categorical datasets should be a sufficient sample size to further analyze and test our proposed assumption.