This project makes use of the NYC open crime data at https://data.cityofnewyork.us/Public-Safety/NYPD-Complaint-Data-Historic/qgea-i56i.
The goal is to leverage the most recent total felony data across the NYC area and apply Kernel Density Estimation to show the concentration of crime in the most dangerous areas. From this map, we are able to query and rank safe routes of transportation according to the mean crime density that a route will incur! This uses googlemaps API so you will need your own API key to run it yourself.
Note that this is just intended to be a toy project to showcase what could be a useful feature in google maps. The eventual target audience of the project is tourists or newcomers to the city who don't have local intuition about how to navigate safely, but the current density map is not intended to be perfectly accurate for practical deployment.
The code supports driving, walking, public transit, and biking as modes of transportation between any start and end address provided.
To run the code: python main.py "start-address" "end-address" "mode of transporation"
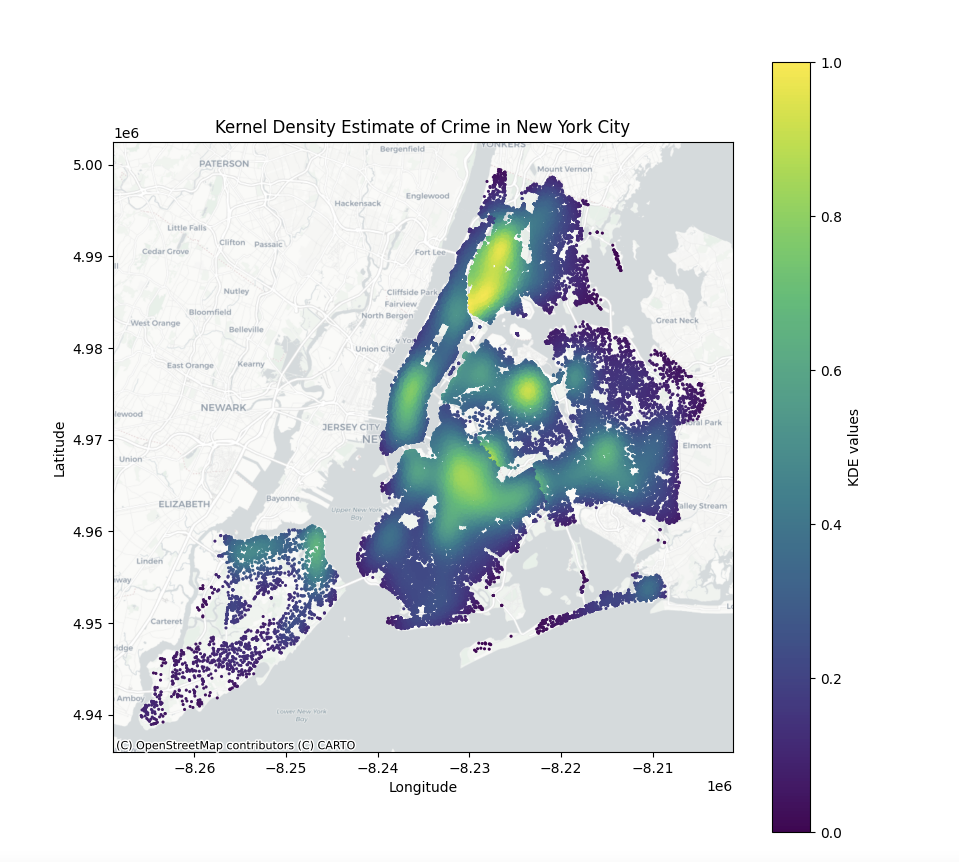
Here is the crime map obtained:
Here is a sample drive from East Harlem to the Hudson River area:
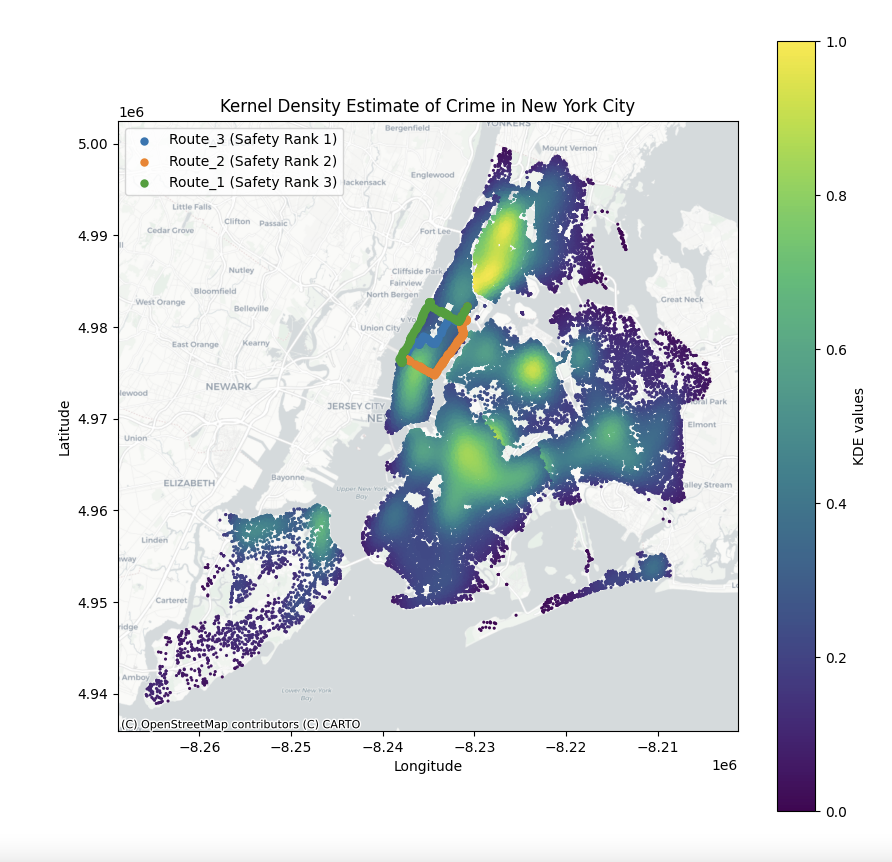
Stay safe NYC!