A Python package providing matplotlib style for scientific plotting with traditional Chinese color palette.
You can install the package using pip:
pip install cmplstyle- A collection of 365 traditional Chinese colors.
- Optmised matplotlib style for scientific plotting.
- Small handy functions for helping scientific plotting.
Our color collection is sourced from the reference 《中国传统色:国民版色卡》 by 郭浩, featuring hues widely used in traditional Chinese art and design. See here for a complete color reference.
The color names are in Chinese and their HEX color values are stored in the cmplstyle.TCC dictionary. Once the package is imported, the colors can be accessed easily by their names. For example,
import cmplstyle
import seaborn
seaborn.palplot(["群青", "西子", "胭脂", "桂黄", "苍苍", "青骊", "官绿", "米汤娇", "沧浪", "梅子青", "石榴裙"])
will plot a color palette with the specified colors in the list:

For readers unfamiliar with Chinese characters, the colors can also be accessed by the numbered indices (TCC_1 through TCC_365). See here for a complete indexed color reference.
The package provides conversions between Chinese color names and their TCC_ indexed names: use cmplstyle.color_index_to_name to retrieve the Chinese name for a given TCC_ index, and cmplstyle.index_name_to_color to find the corresponding TCC_ index for a Chinese color name.
The package includes a built-in Matplotlib style. Activate it with:
import cmplstyle
cmplstyle.use_builtin_mplstyle()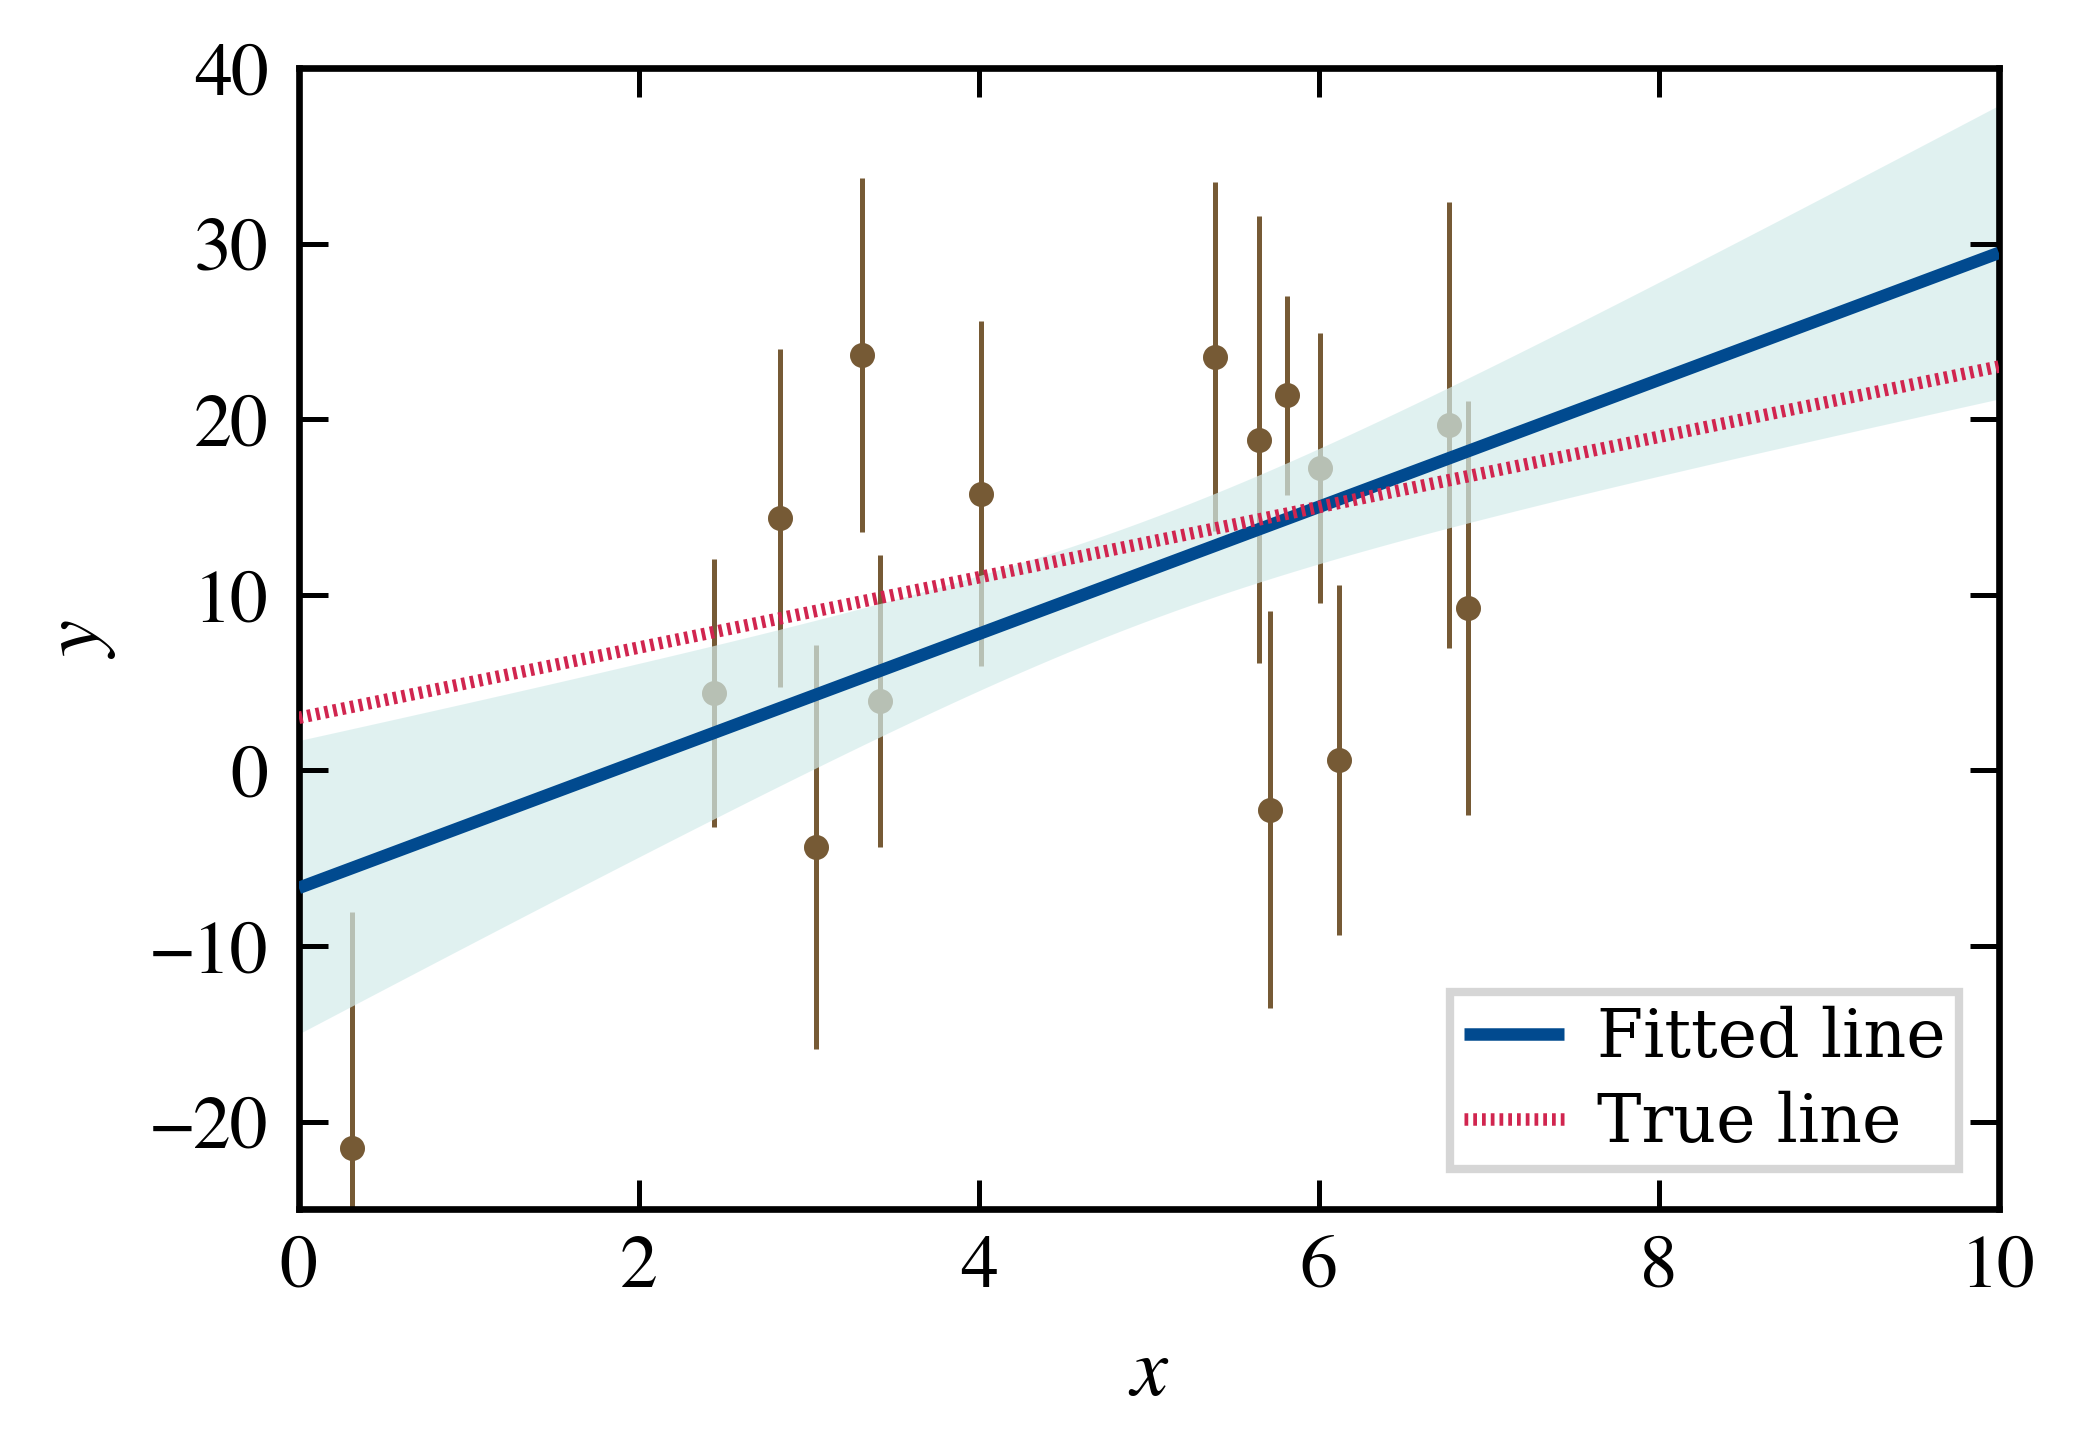
View Plotting Code
import numpy as np
import matplotlib.pyplot as plt
import cmplstyle
from cmplstyle import onecol_wth, cm2inch

cmplstyle.use_builtin_mplstyle()
np.random.seed(20)

F = lambda x: 2.0 * x + 3.0
X = np.linspace(0, 10, 100)
N = 15 # sample size
Y_NOISE_STD_MIN = 5.0
Y_NOISE_STD_MAX = 15.0

X_sample = np.random.normal(loc=5, scale=2, size=N)
Y_sample = F(X_sample)
NOISE_STD = np.random.uniform(Y_NOISE_STD_MIN, Y_NOISE_STD_MAX, size=N)
Y_sample += np.random.normal(size=N) * NOISE_STD

# Fit a linear model with numpy
a, b = np.polyfit(X_sample, Y_sample, deg=1)
F_fit = lambda x: a * x + b
residuals = Y_sample - F_fit(X_sample)
RSE = np.sqrt(np.sum(residuals ** 2) / (N - 2)) # Residual Standard Error
SE = RSE * np.sqrt(1 / N + (X - X.mean())**2 / np.sum((X_sample - X_sample.mean())**2))


fig, ax = plt.subplots(figsize=cm2inch(onecol_wth, onecol_wth * 0.7))
ax.errorbar(x=X_sample, y=Y_sample, yerr=NOISE_STD, color="茶色", fmt=".", elinewidth=0.6, markersize=4, zorder=0)
ax.fill_between(X, F_fit(X) - SE, F_fit(X) + SE, facecolor="天缥", edgecolor=None, alpha=0.7, zorder=1)
ax.plot(X, F_fit(X), color="空青", label="Fitted line", zorder=3)
ax.plot(X, F(X), color="娇红", ls="dotted", label="True line", zorder=4)

ax.set_xlabel("$x$")
ax.set_ylabel("$y$")
ax.set_ylim(bottom=-25, top=40)
ax.set_xlim(left=0, right=10)
ax.legend(loc="lower right", prop={"family": "DejaVu Serif"})If you want to cite this package in your work, please use the following BibTeX entry:
@software{cmplstyle2025,
  author       = {Jinyi Liu},
  title        = {jinyiliu/cmplstyle: cmplstyle},
  month        = aug,
  year         = 2025,
  publisher    = {Zenodo},
  version      = {latest},
  doi          = {10.5281/zenodo.16903969},
  url          = {https://doi.org/10.5281/zenodo.16903969},
}This package is licensed under the MIT License.