The car insurance claims data is a fictitious data compiled by Onyx data for data analysis challenge of August 2023. Together with a group of like-minded analysts, we decided to analyse the data using Microsoft Excel.
Analysing this type of data will be useful to: Insurance company in the setting premiums for car types, individual categories, etc. Knowing high risk individuals, professions, and areas Know defective cars. Useful to Individual who want to buy reliable cars with no/low crash history.
- Data cleaning
- DAX Language in Measures creation
- The data consists of only one table therefore there was no possibility of data modelling.
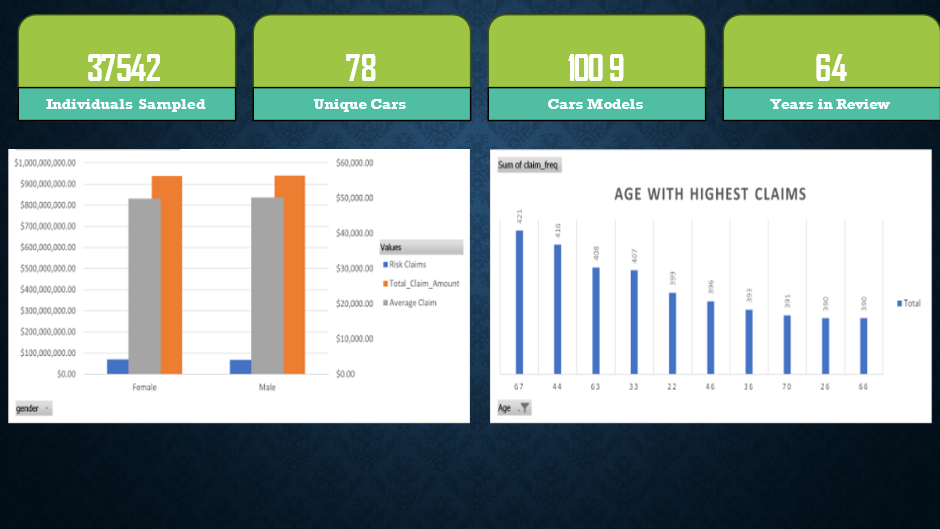 Count of Individuals = 37542
Unique Cars = 78
Car Models = 1009
Car Years = 64
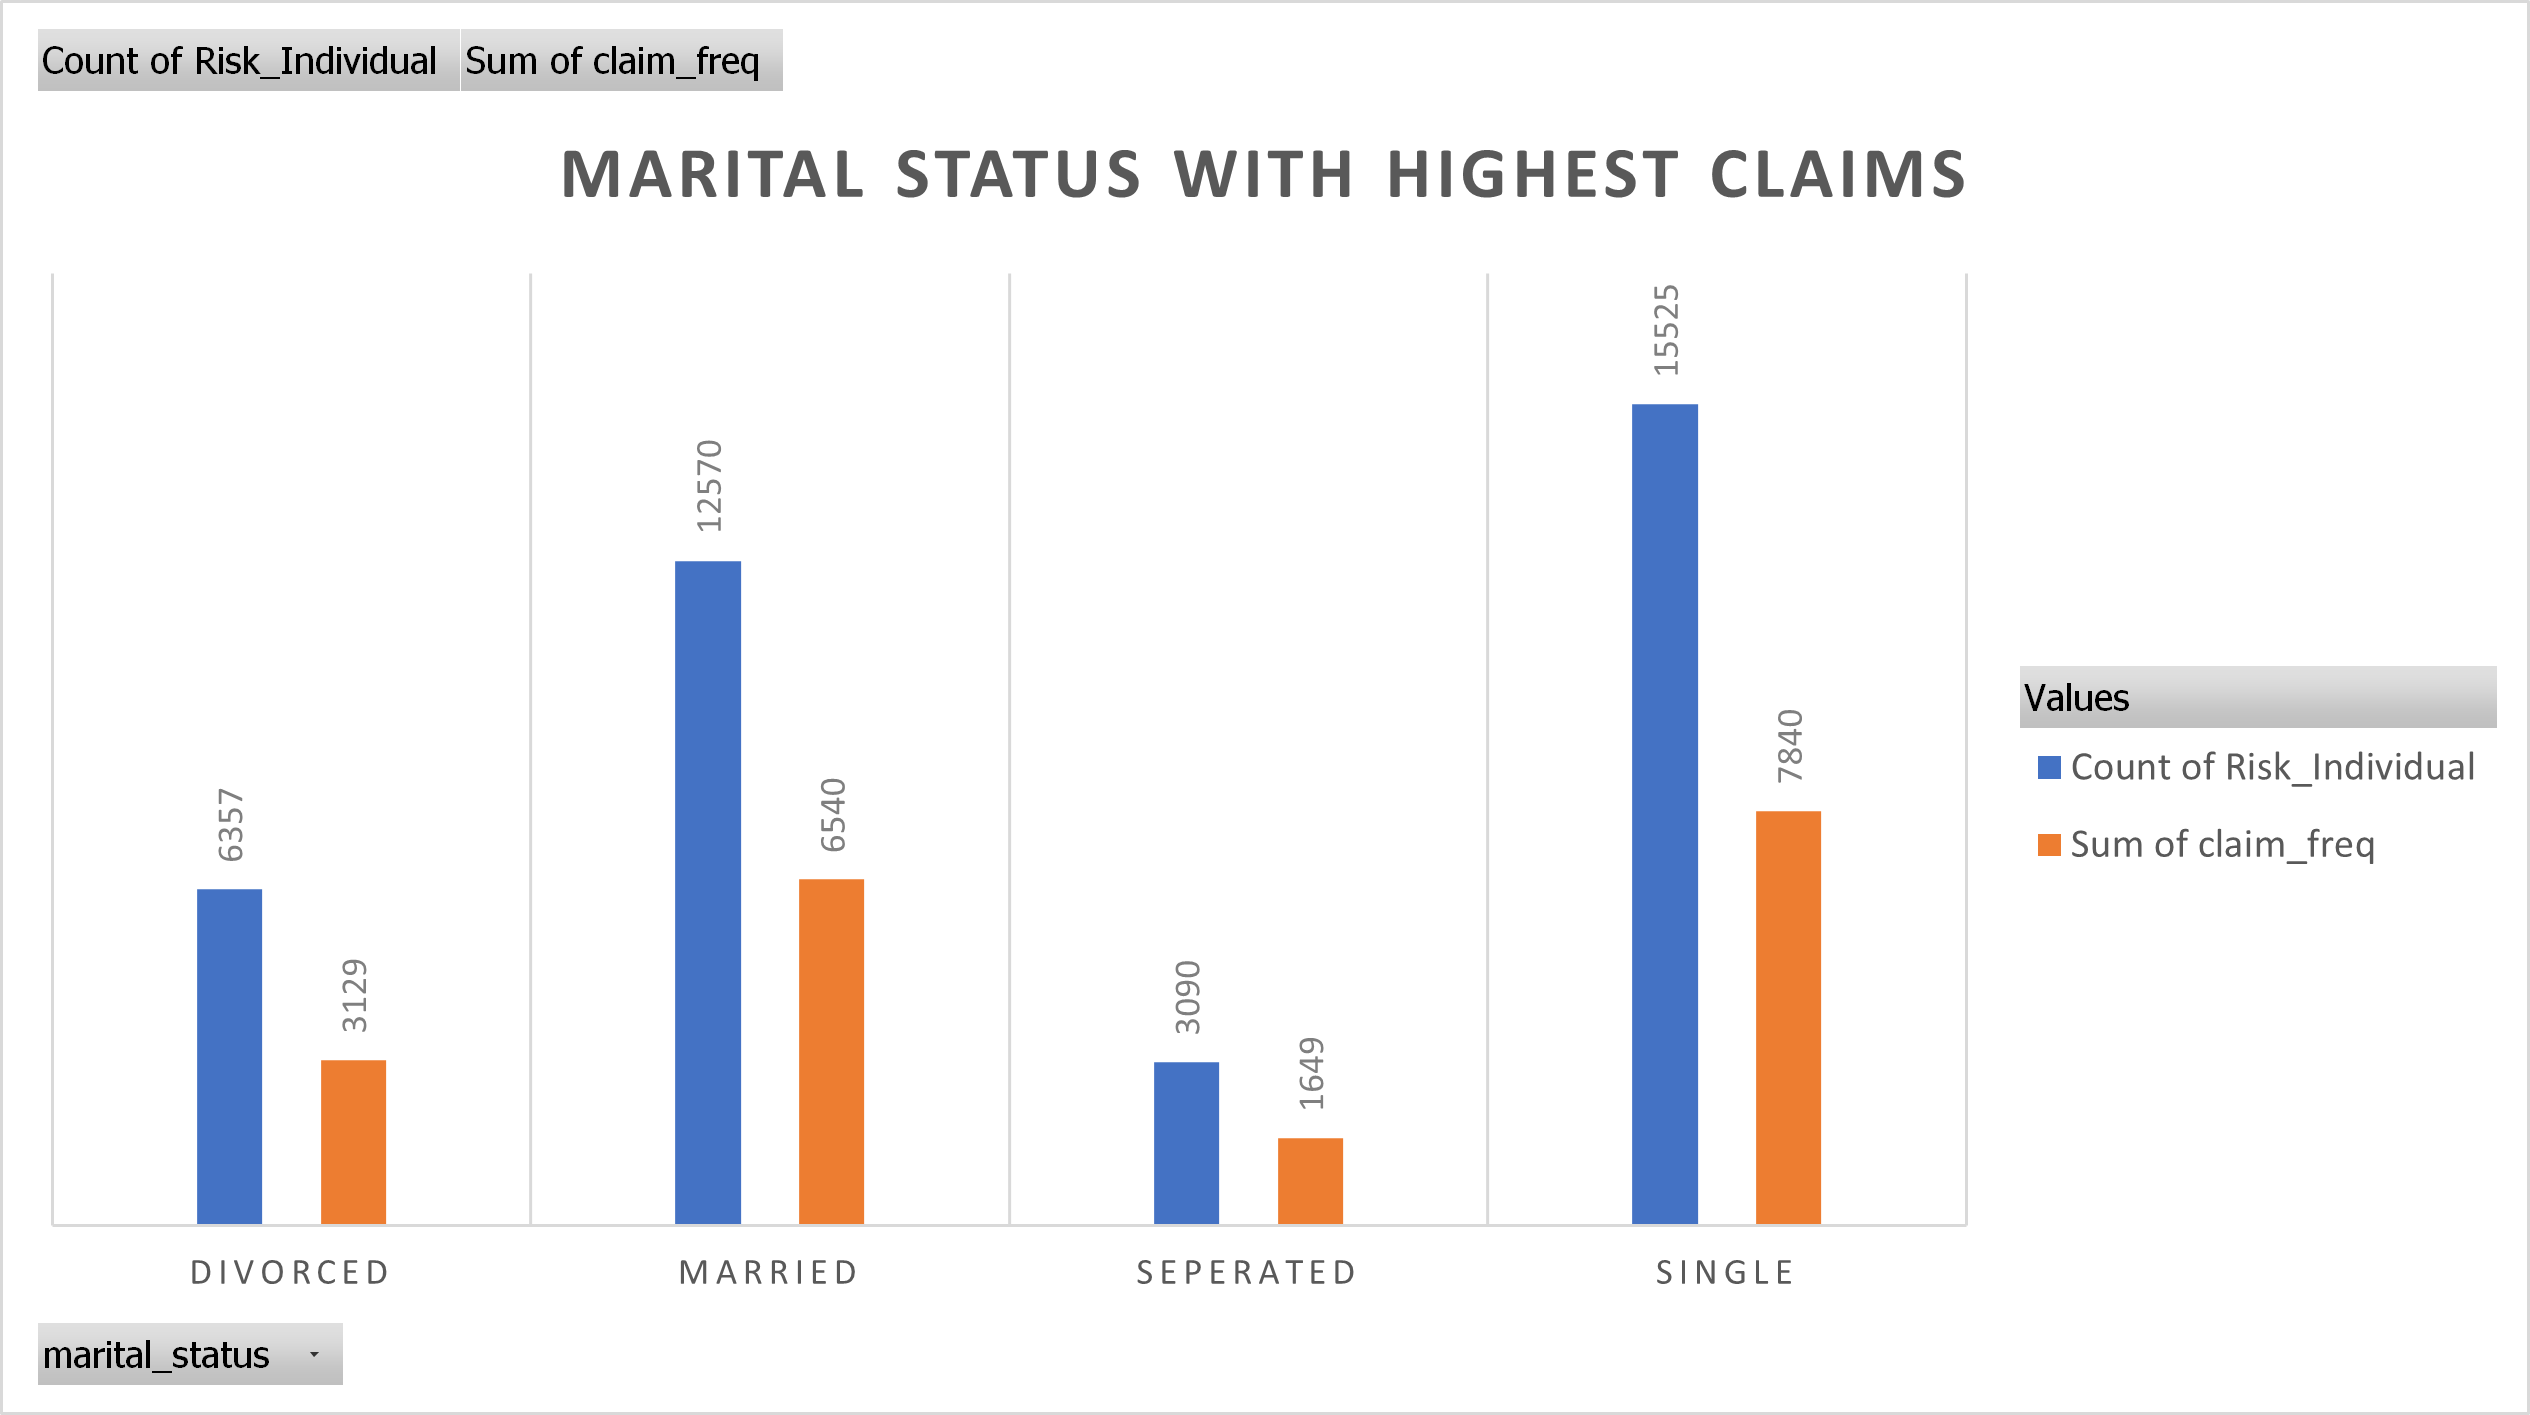
No significant difference in total, average and risk claims by gender. Also, marital status has no significant impact on claim frequency, the highest claim frequency in single individuals is because single individuals have the highest number ratio. See Image Above
Ages with the highest frequency of claims are, 67, 44, 63, 33, 22. Elderly people are sure to have racked up claims over the years while mid aged individuals show high claims and age 22 is a youthful exuberant age with many claims.
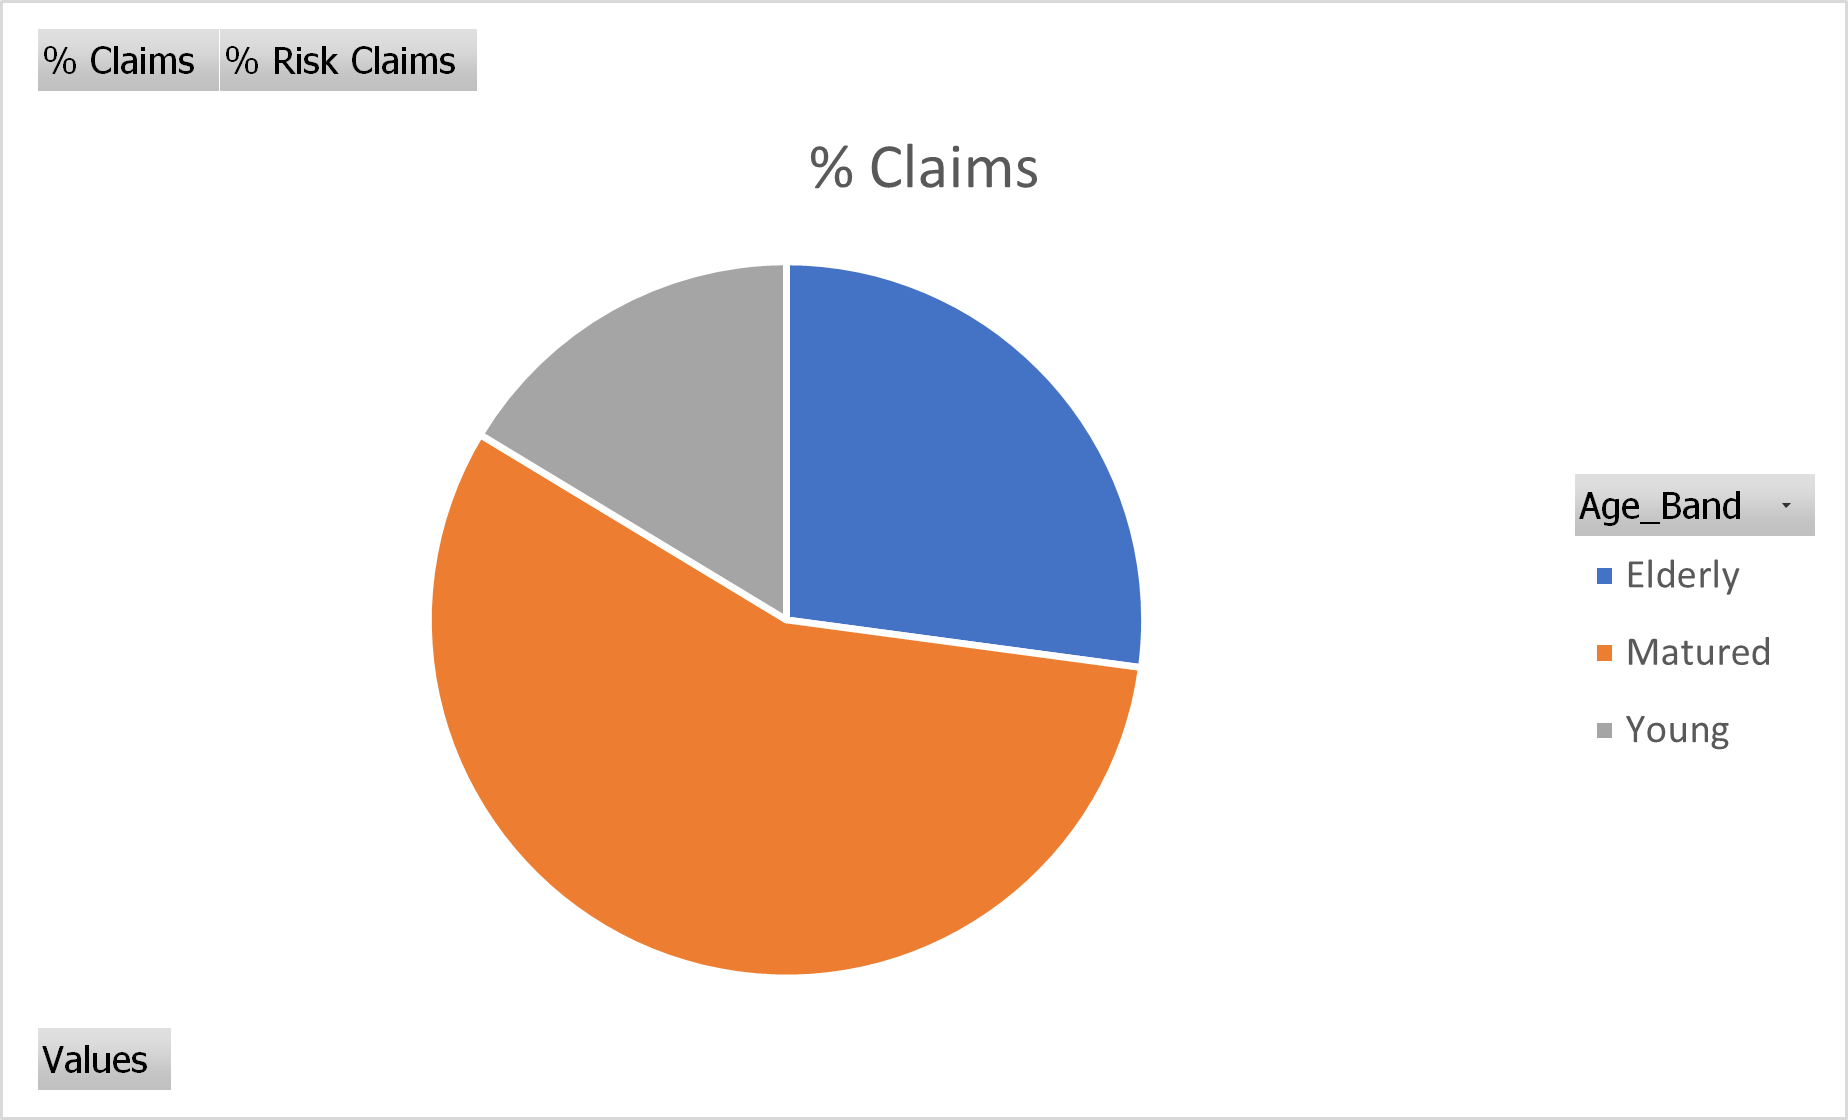 Categorizing the ages into buckets, mid-aged individual possesses the greatest number of claims.
There are no professions data, therefore nothing can be inferred.
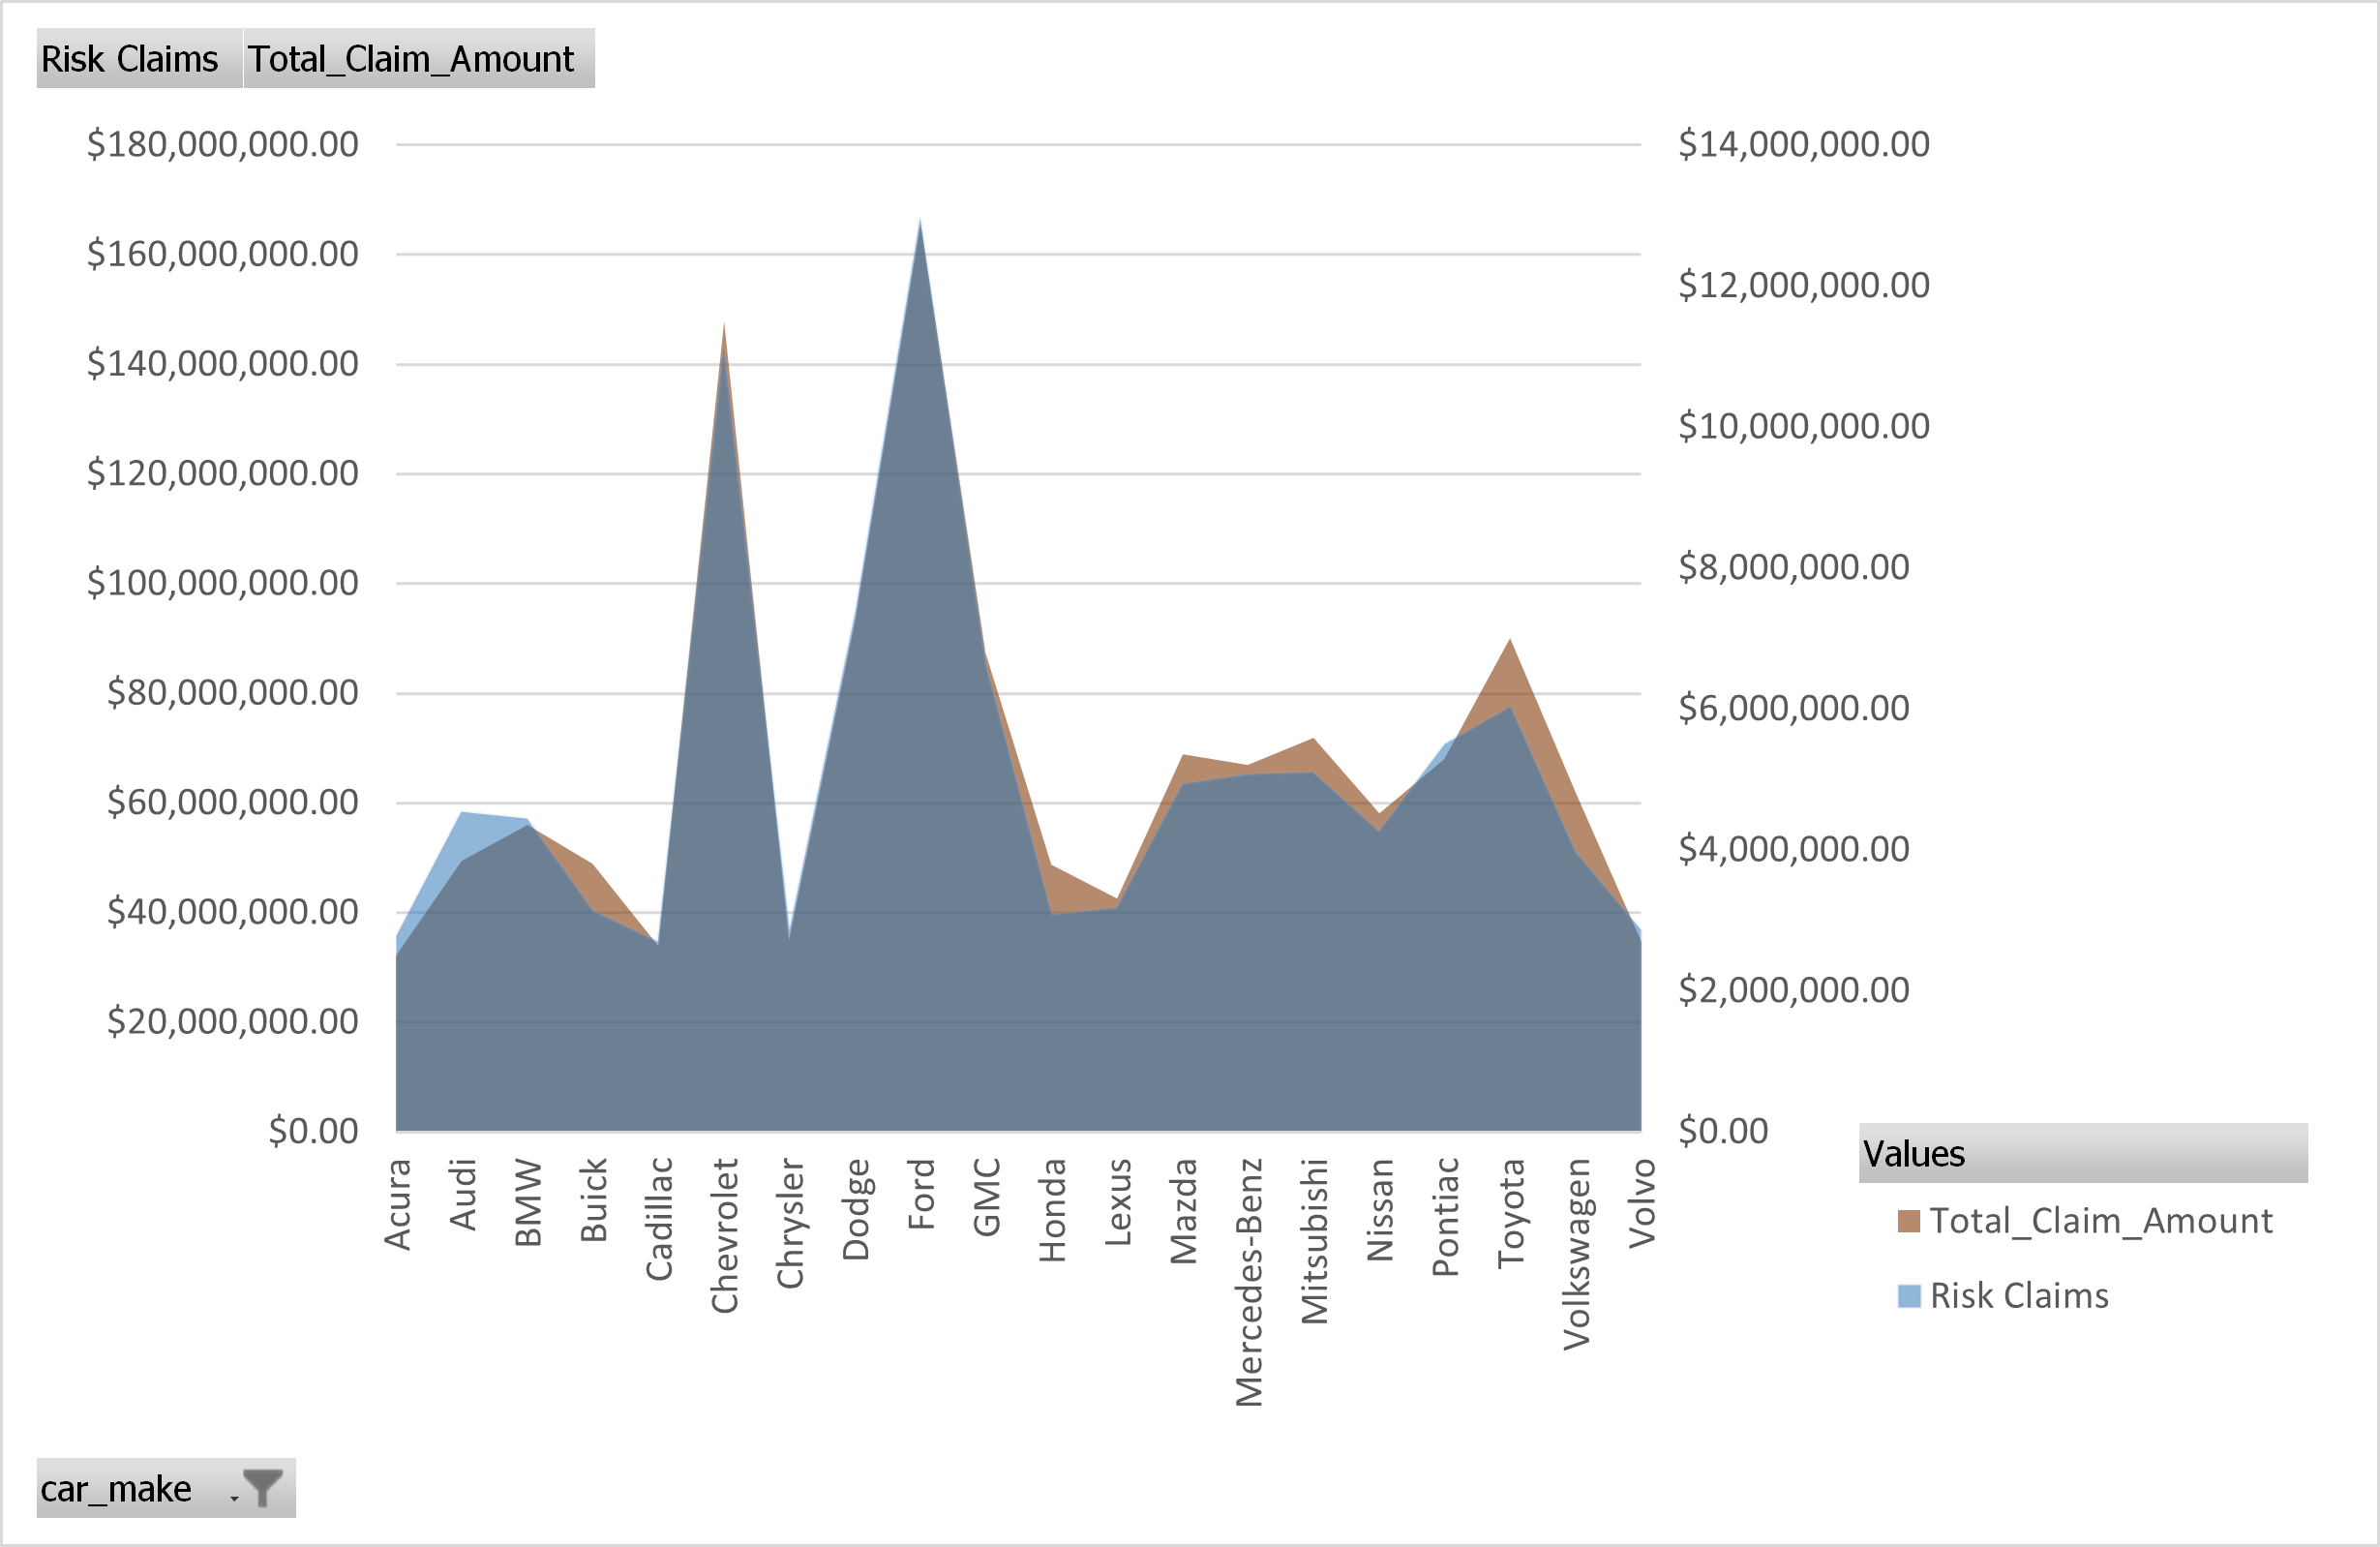
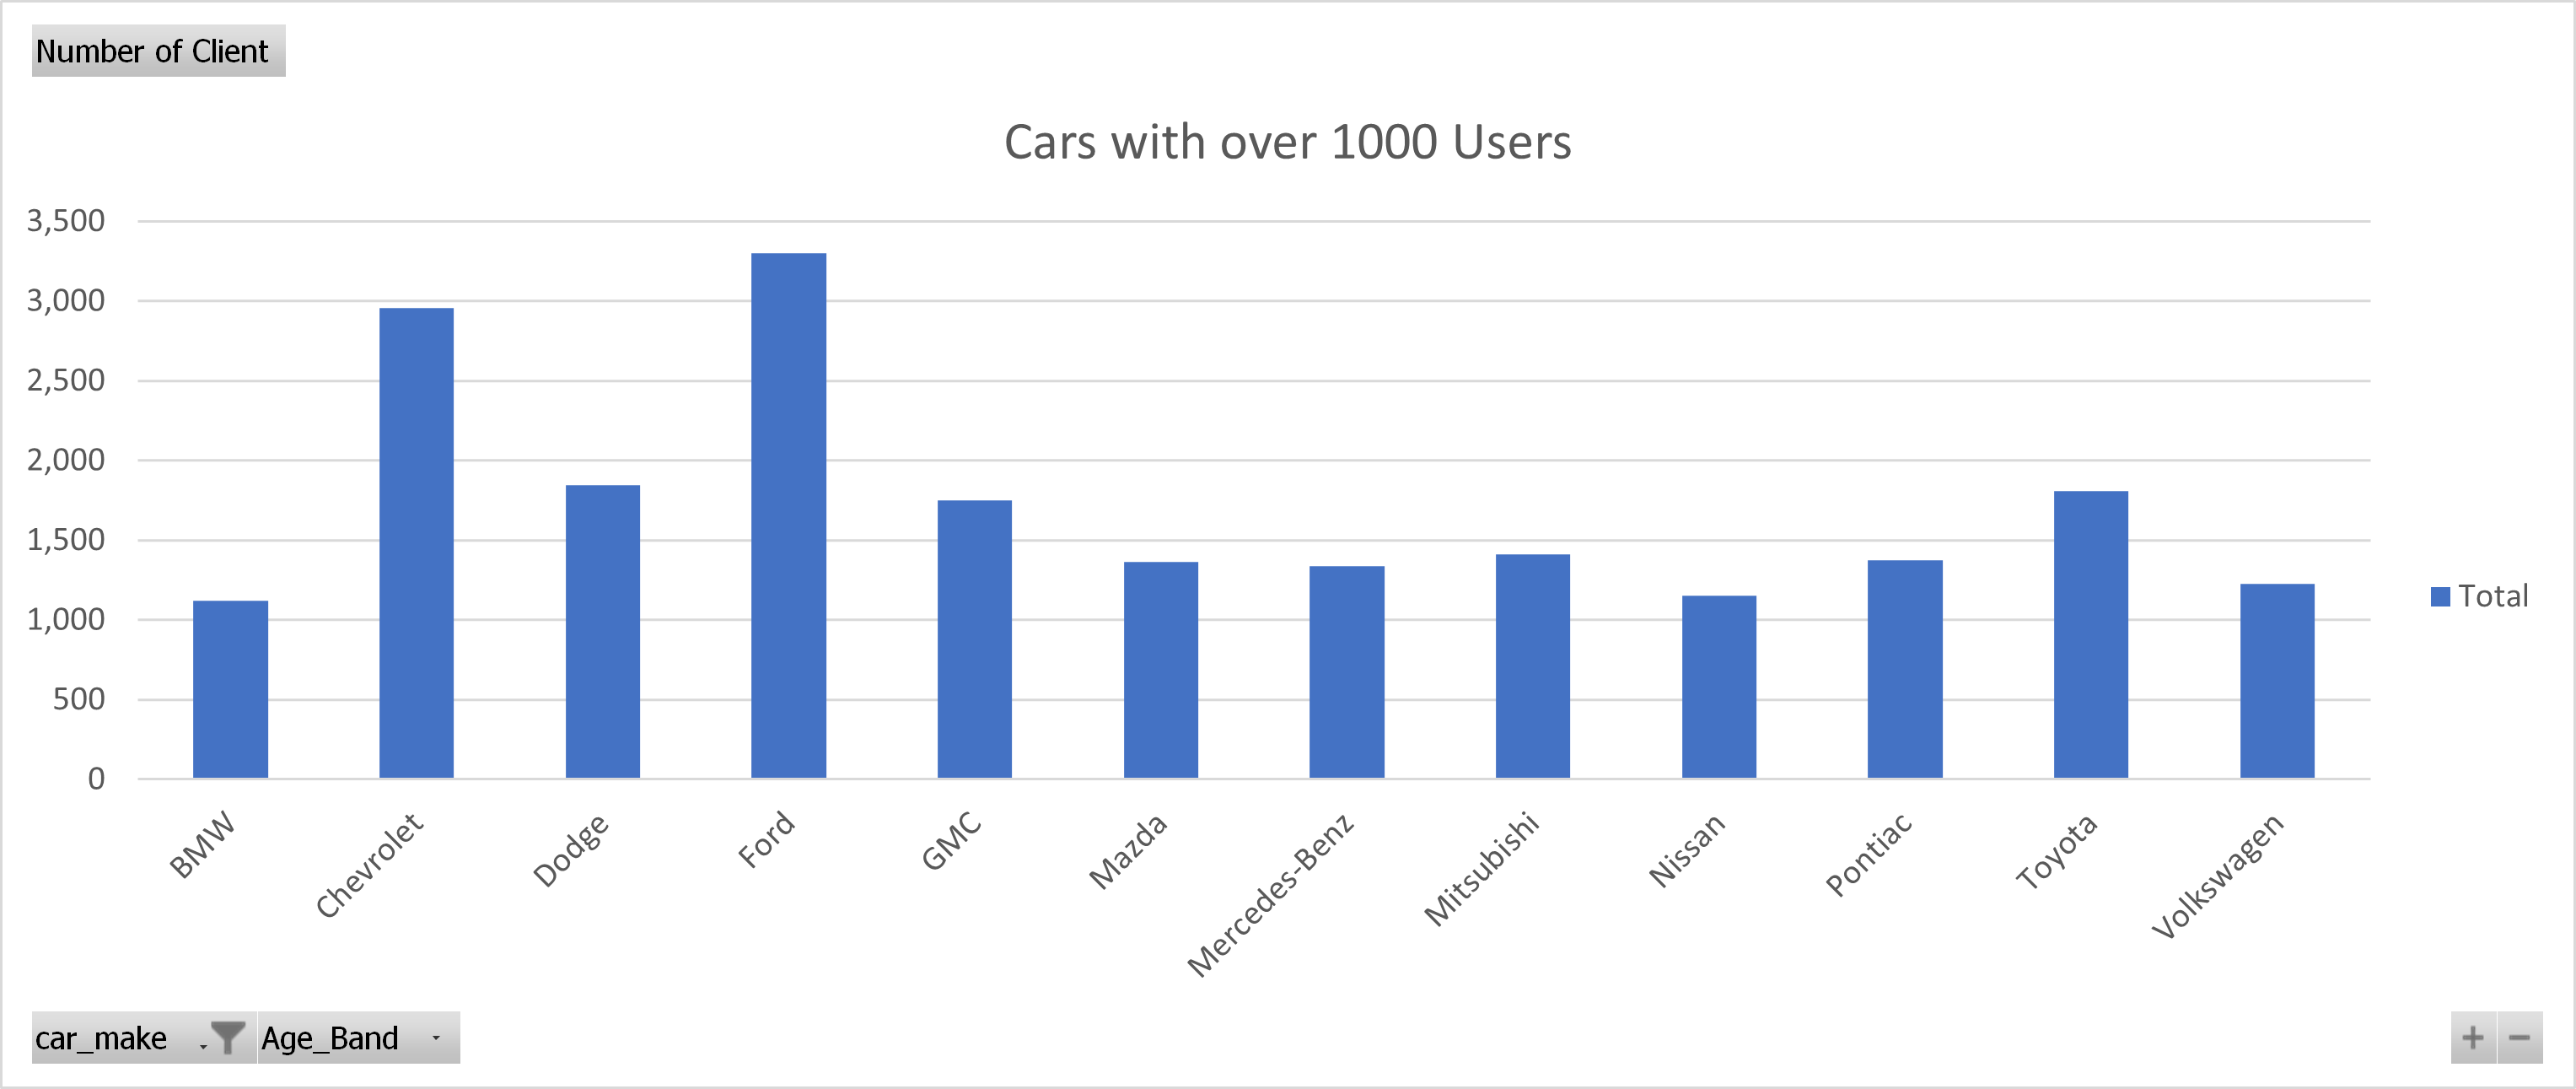
Cars with highest claims are Ford Chevrolet, GMC, and Toyota, this is most likely due to their high possessions by individuals as the image below shows they are among the cars used by over 1000 individuals.
However, the particular year of car models with greater frequency of claims are; 2012 GTI, 2006 Caravan, 2010 Altima, this results and car name shows family cars are more usually involved in insurance claims.
| Cars with over 1000 Users | Cars with over 1000 Users Condensed |
|---|---|
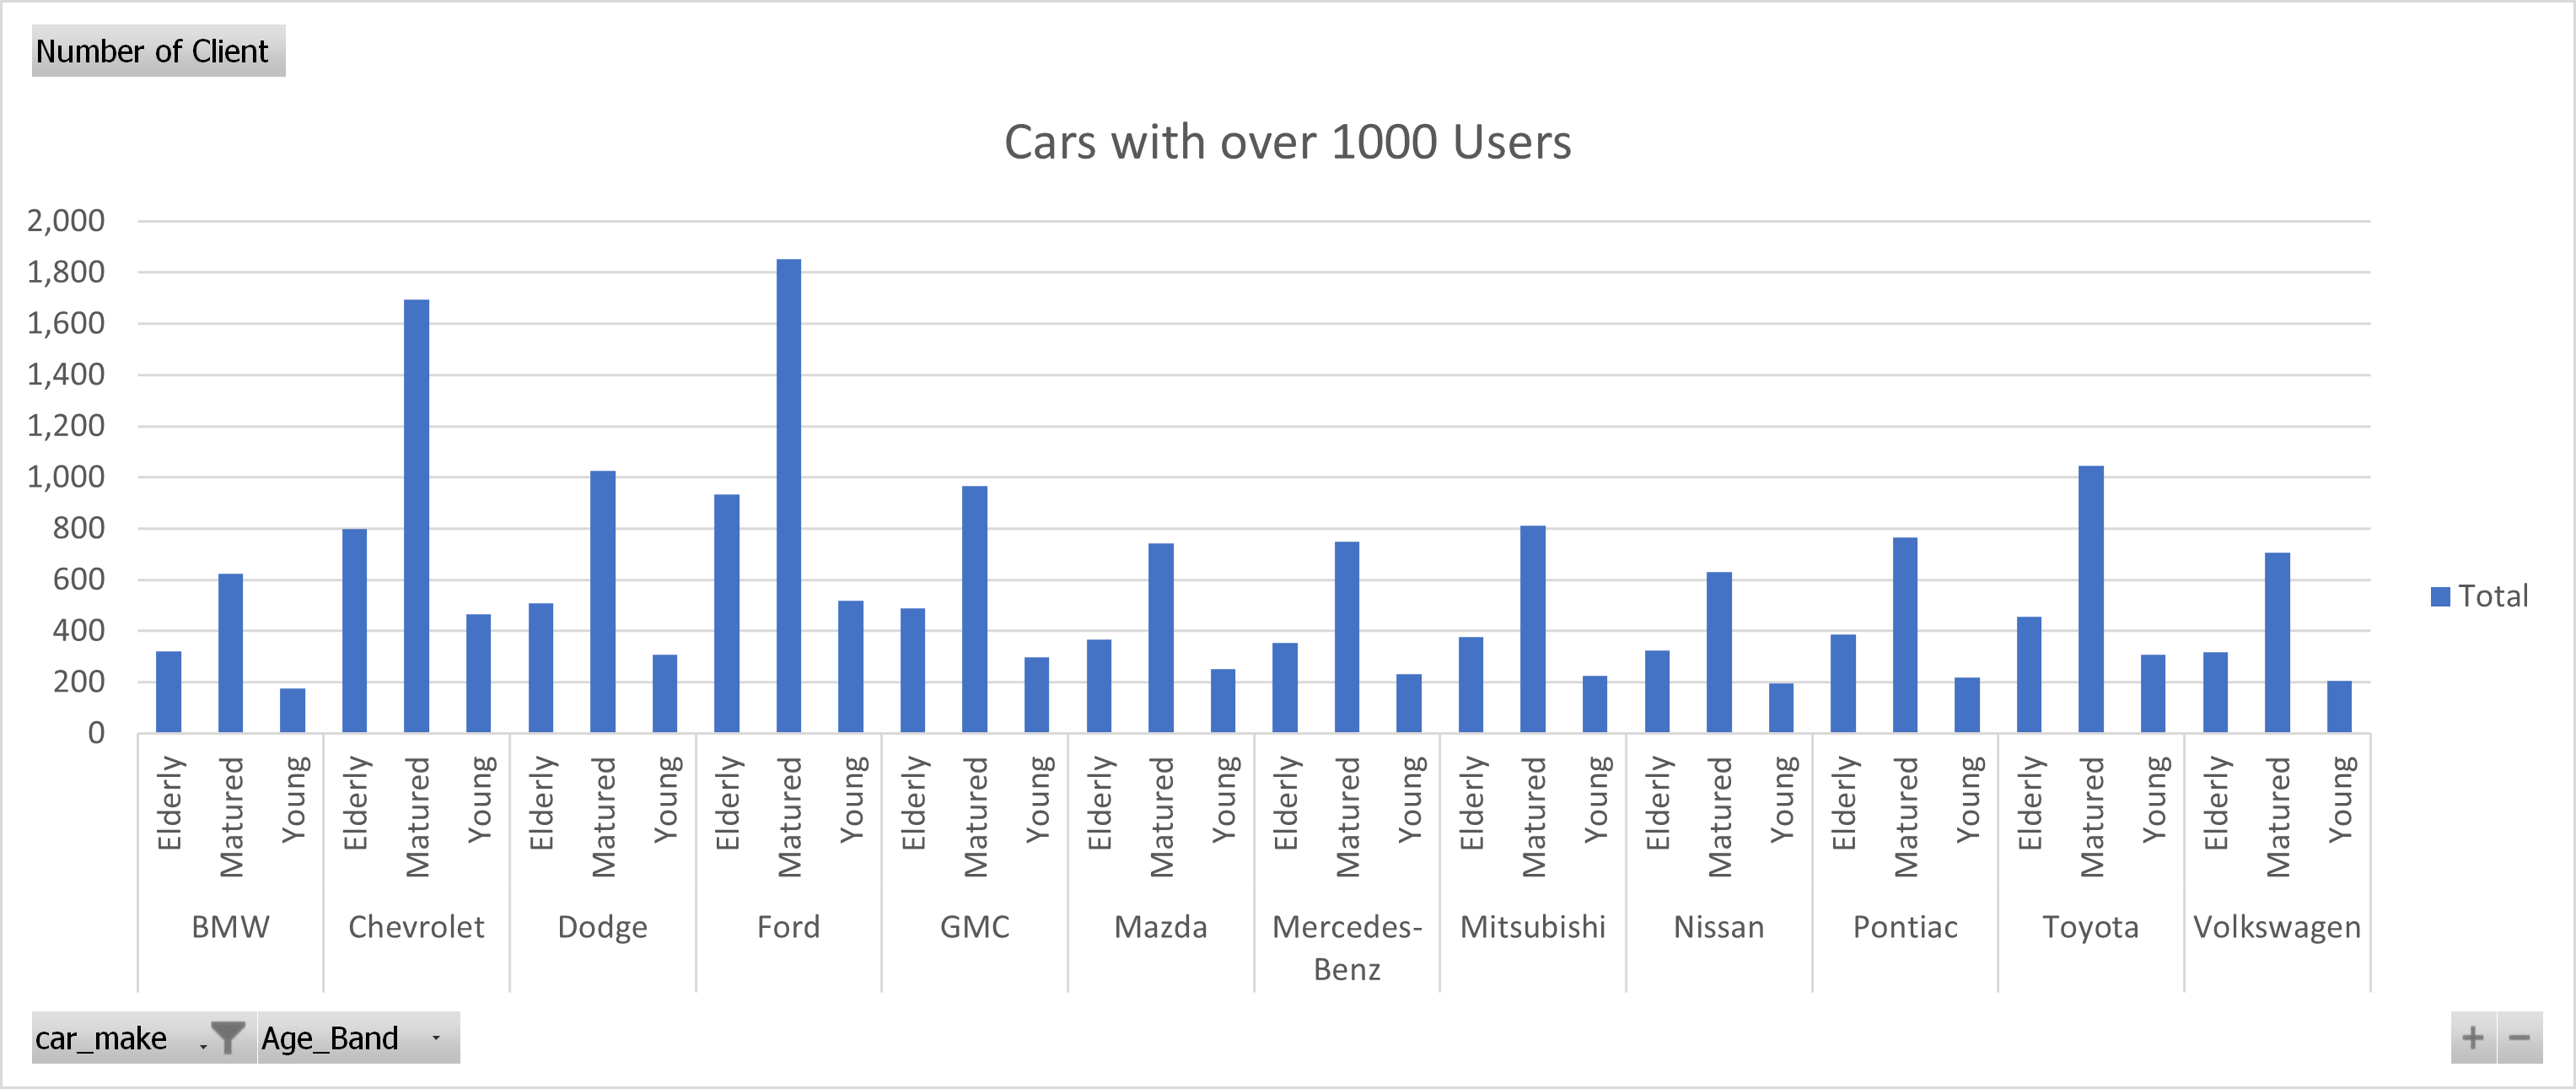 |
 |
Insights from data shows the age ranges of individuals with car insurance claims and cars with greater frequency of insurance claims
link to the dasbboard is here