The performance reported by ERM is an estimate of the actual performance of a numerical kernel when run on a platform with the given microarchitectural parameters. The figures below show the comparison of the performance estimated by ERM when it models a Sandy Bridge microarchitecture with the actual measured performance when the code is executed on an Intel Xeon E5-2680 (measured data is obtained with hardware performance counters [1]). We show examples for both scalar and vector numerical kernels.
As shown in the figures, ERM accurately estimates performance and performance trends for some applications. In the case of FFT, for example, estimated performance is on average (the mean across all sizes) 1.22x the measured performance of the icc-compiled code, and 1.31x the performance of the clang-compiled code. For the other computations, however, the difference is more significant. In the case of WHT, for example, average estimated performance is 2.58x and 4x the measured performance for the iterative and recursive implementations, respectively (differences with measured performance). Further, as shown in Figure 2, the accuracy of ERM is competitive with the accuracy of MARSSx86 [2].
What is important, is that ERM reports the detailed properties of the scheduled DAG, which are not easily available in state-of-the-art simulators or measurements on real hardware, and enable the derivation of the additional performance bounds in the roofline plot.
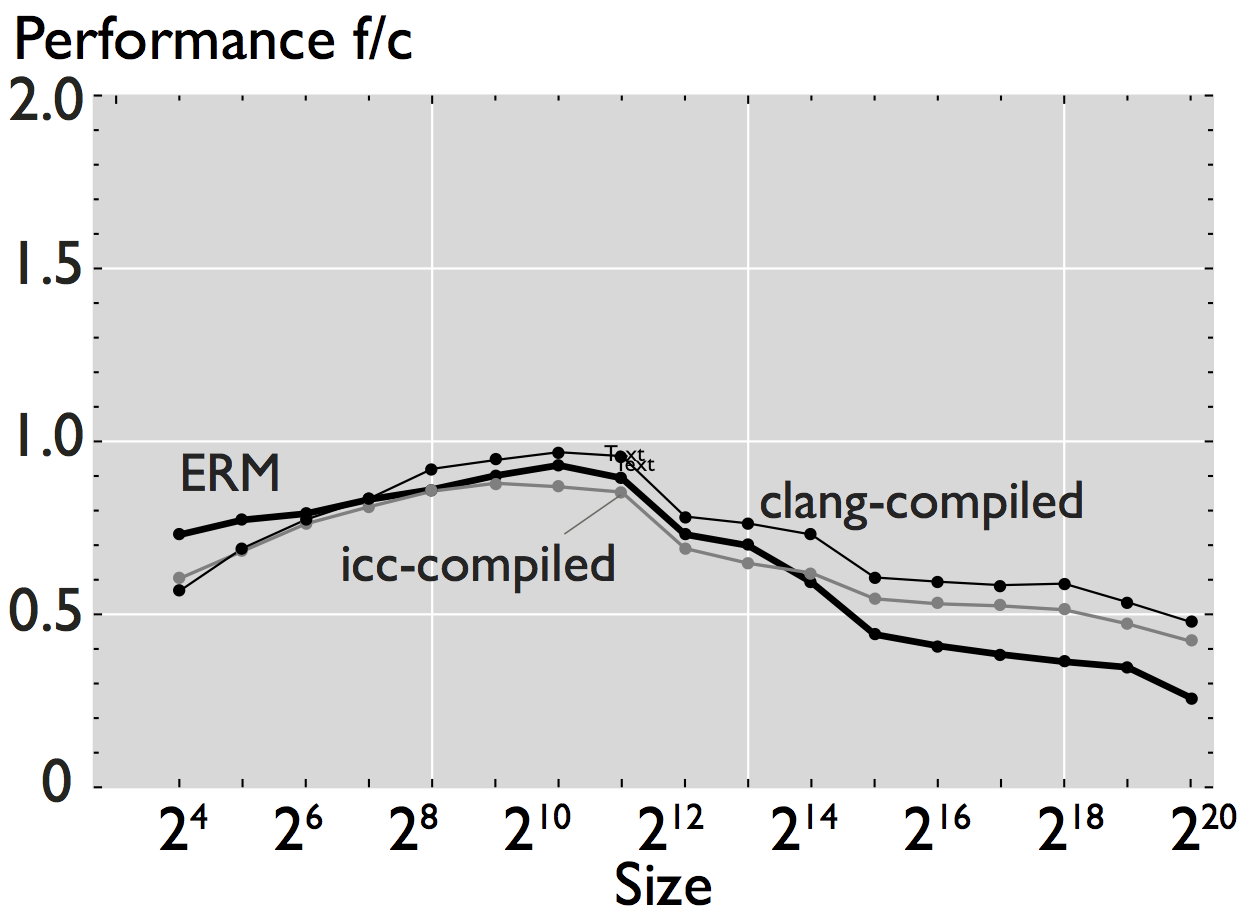
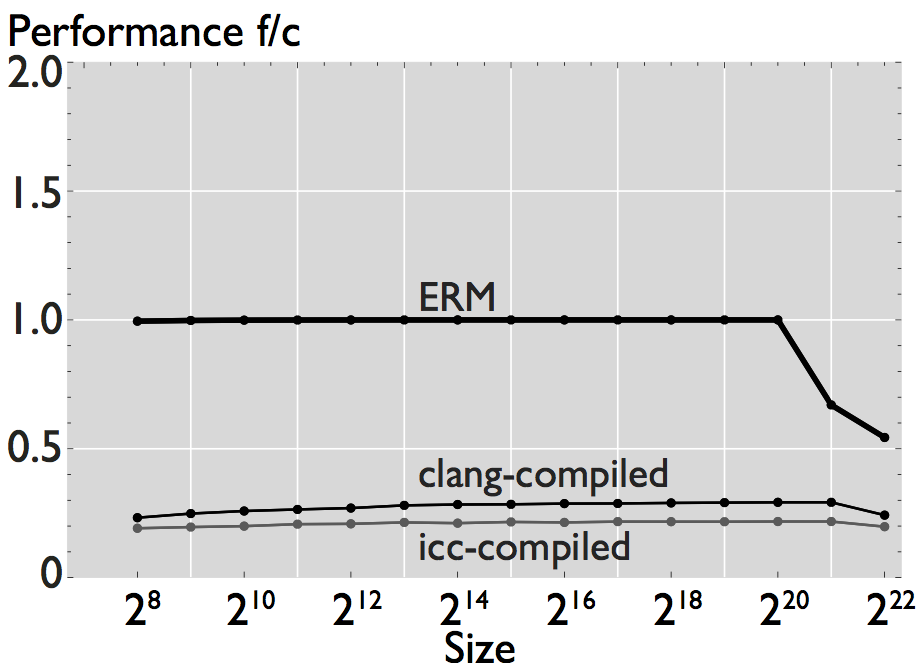
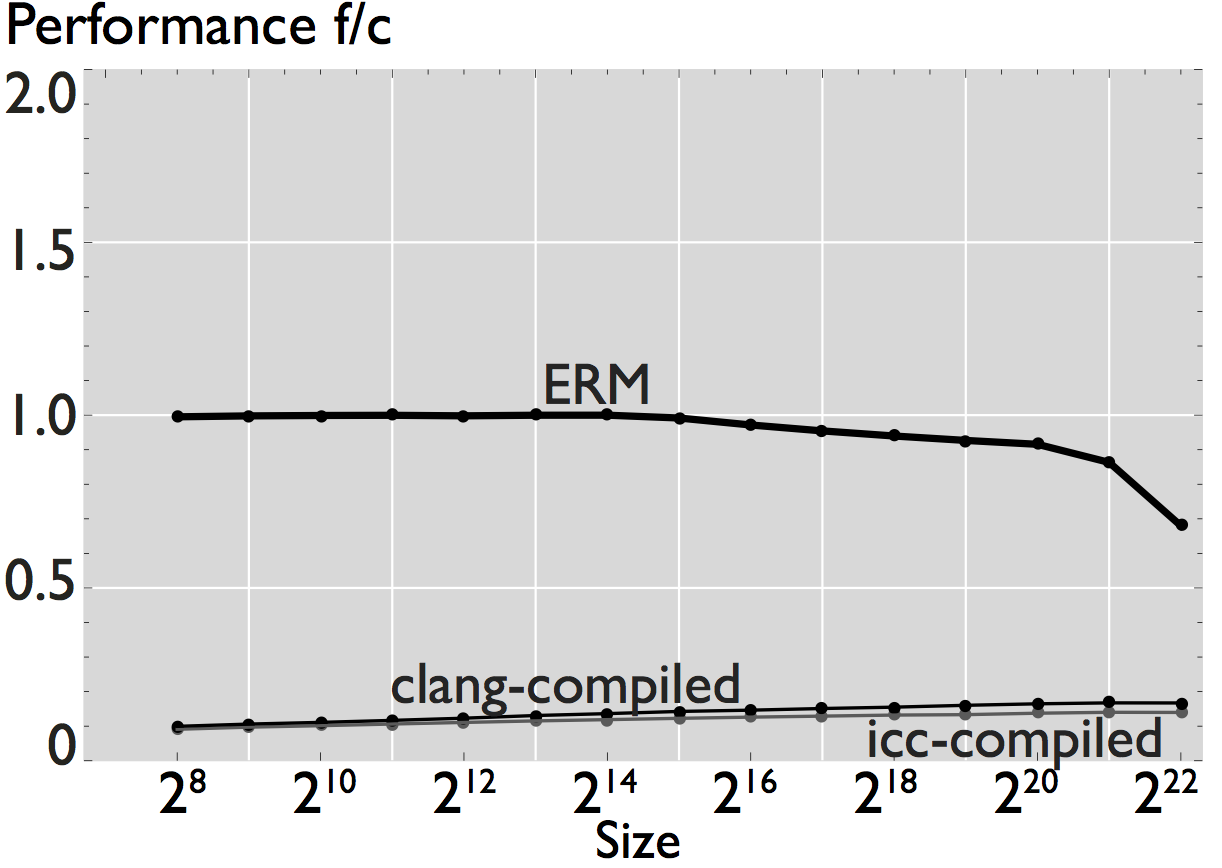
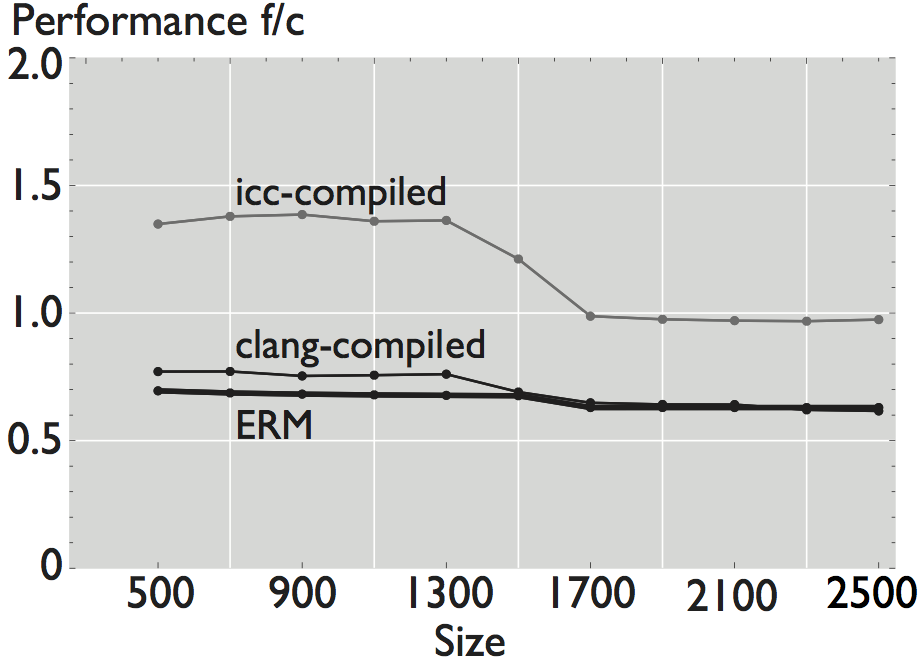
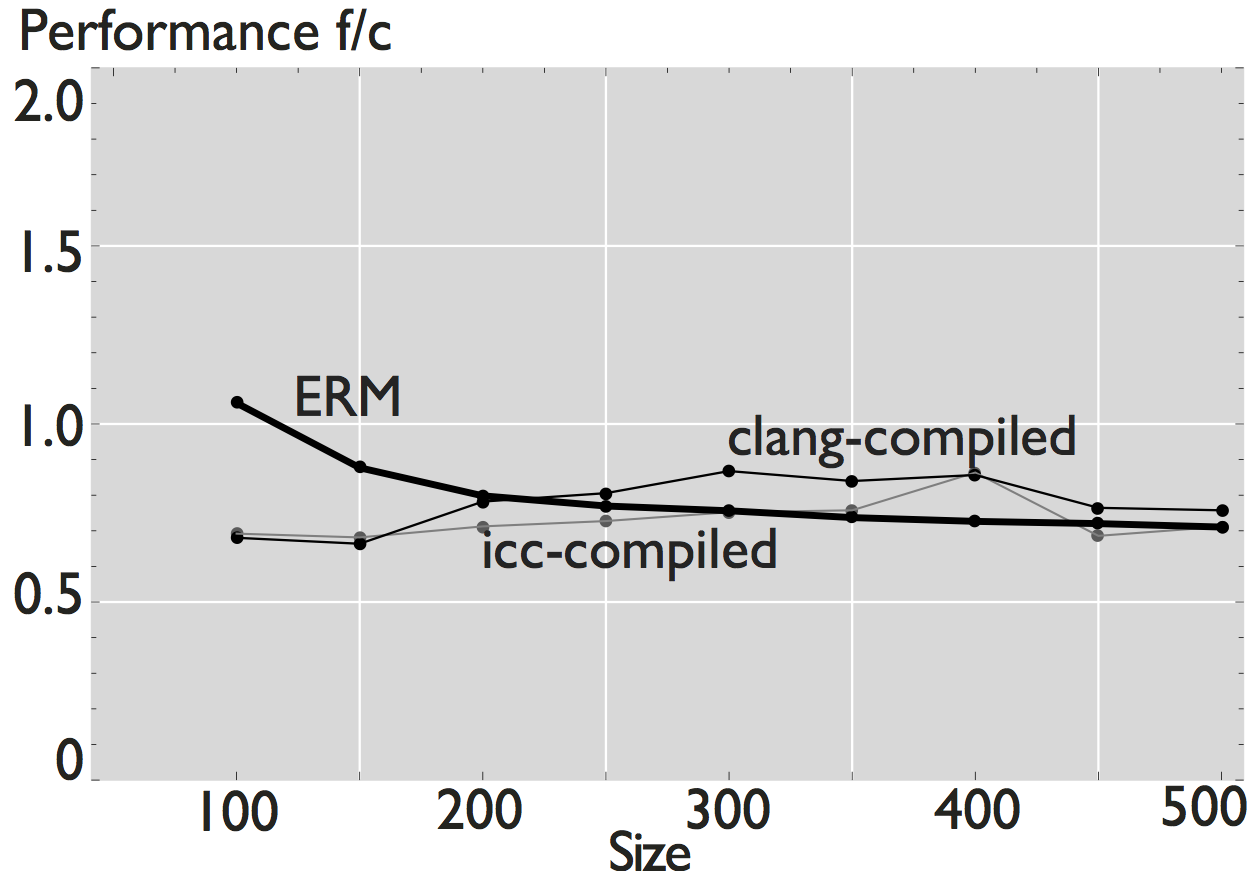
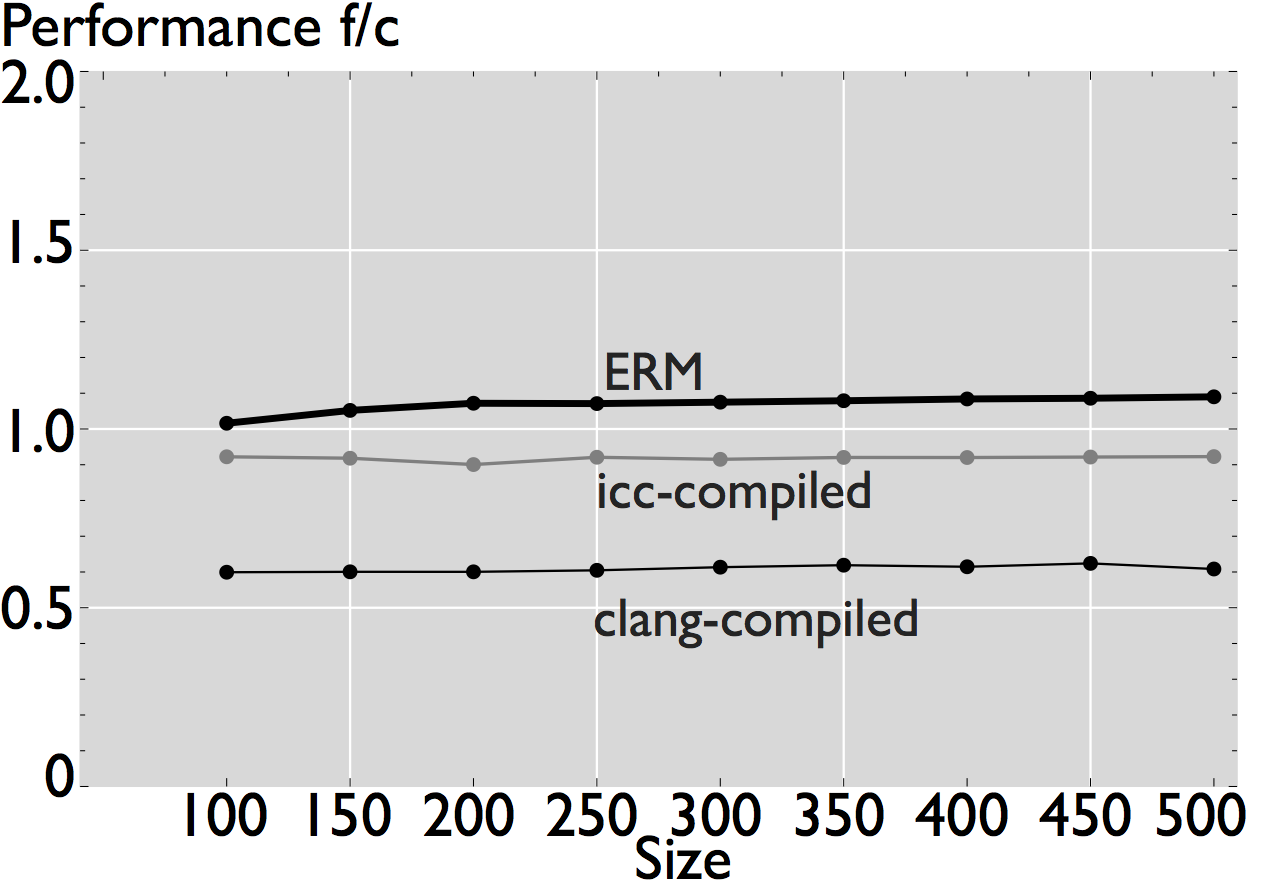
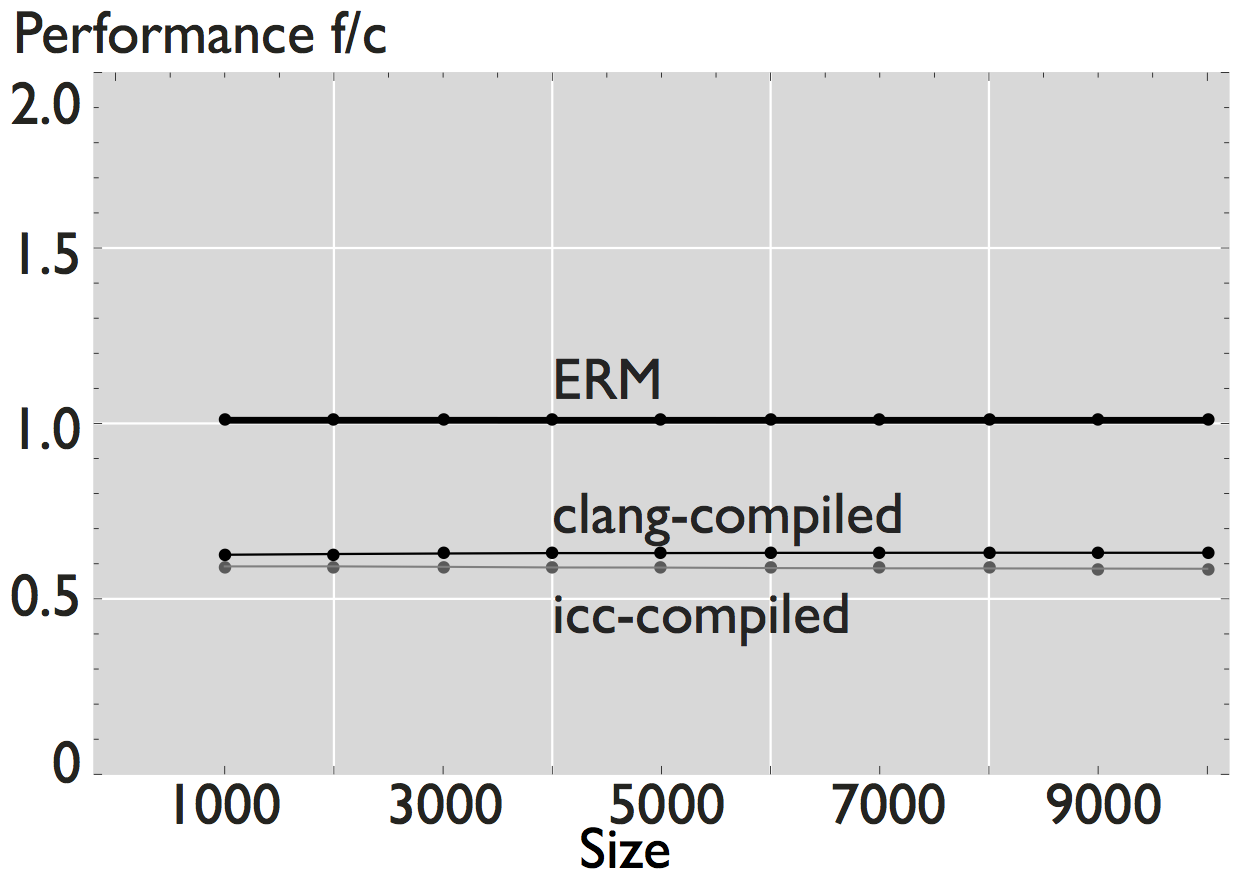
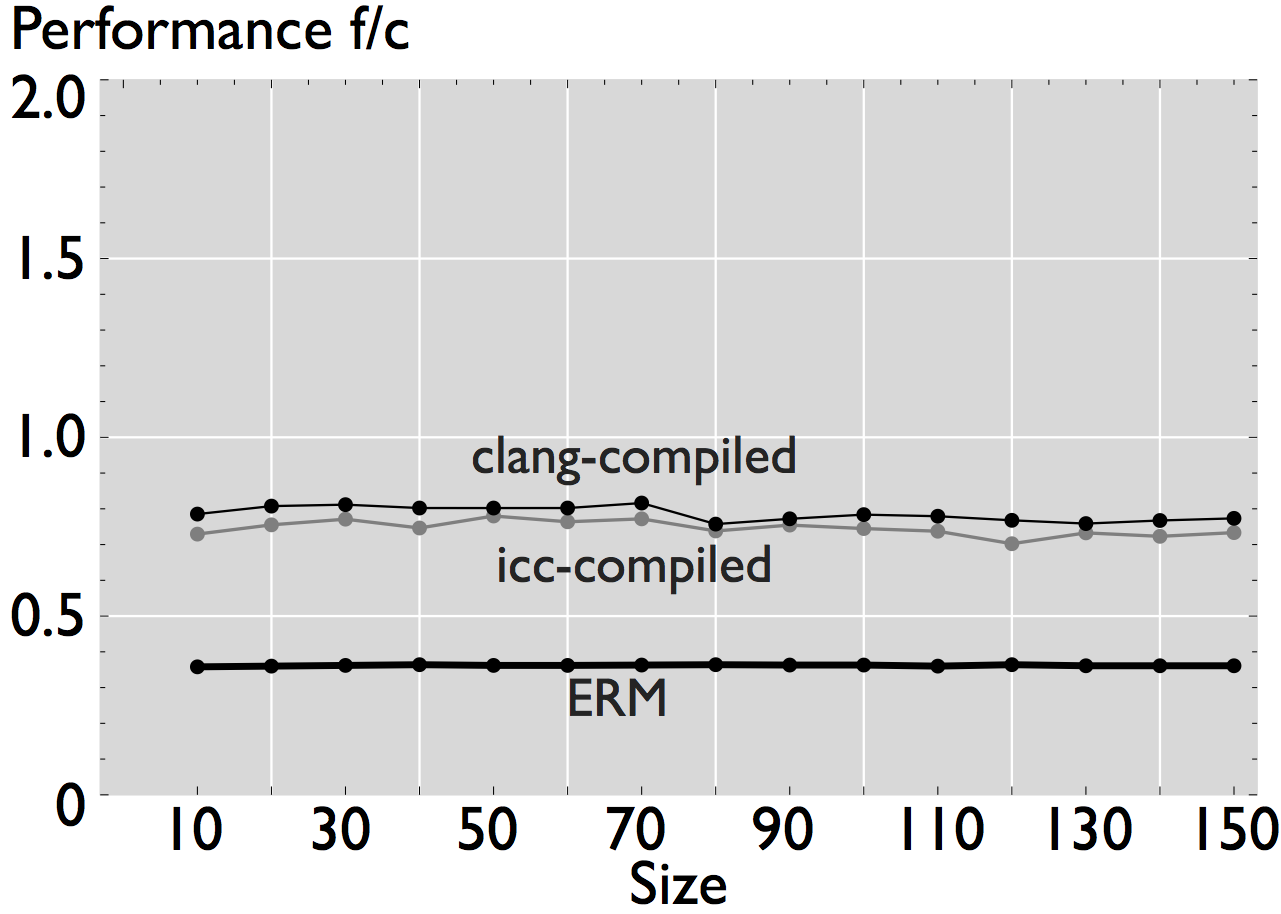
Figure 1: Comparison of performance for 8 hand-written scalar numerical kernels. The data reported in the plots is the mean value of 20 repetitions. For small size kernels we reduce the error induced by measuring overhead by executing the kernel several times. All kernels operate on double-precision data, and all the results shown correspond to a warm cache execution.
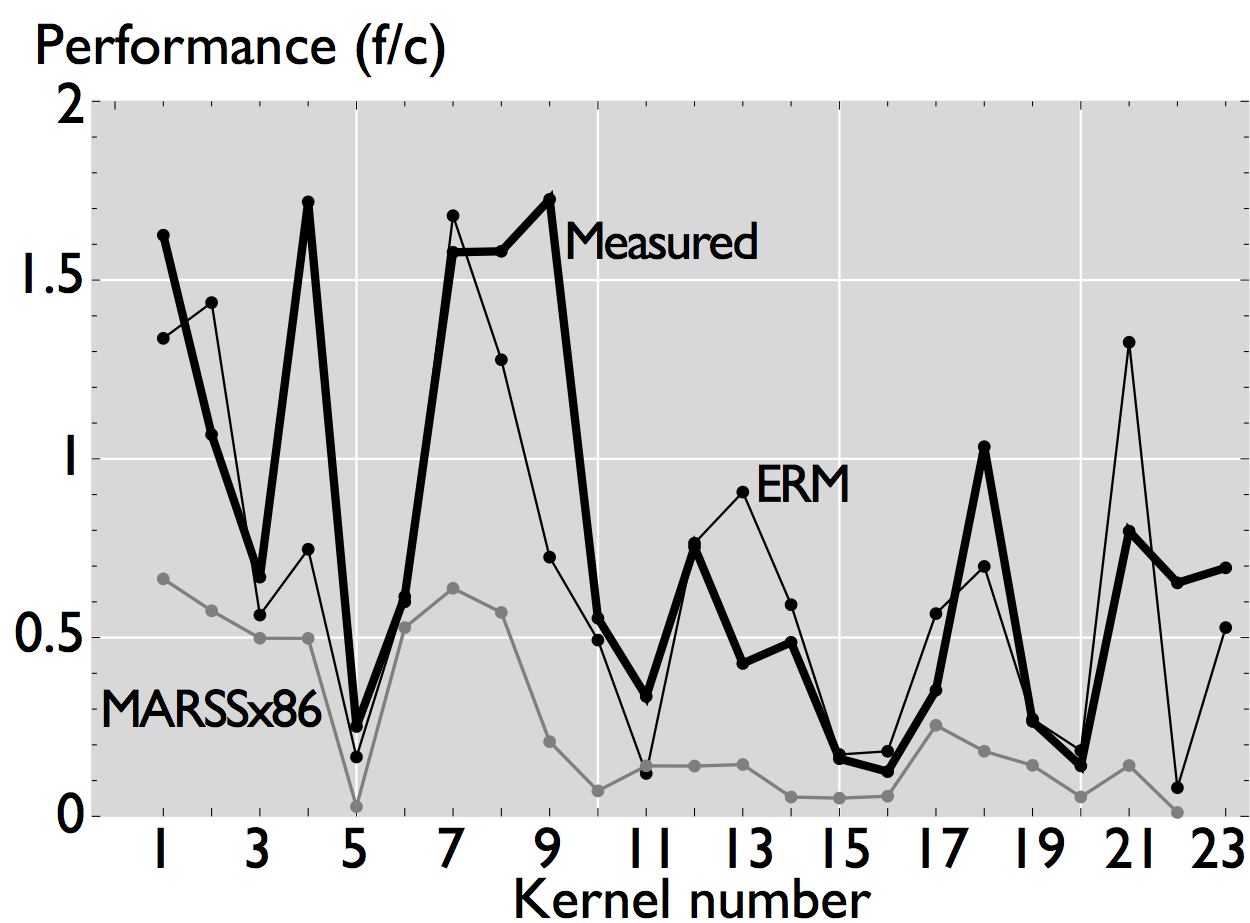
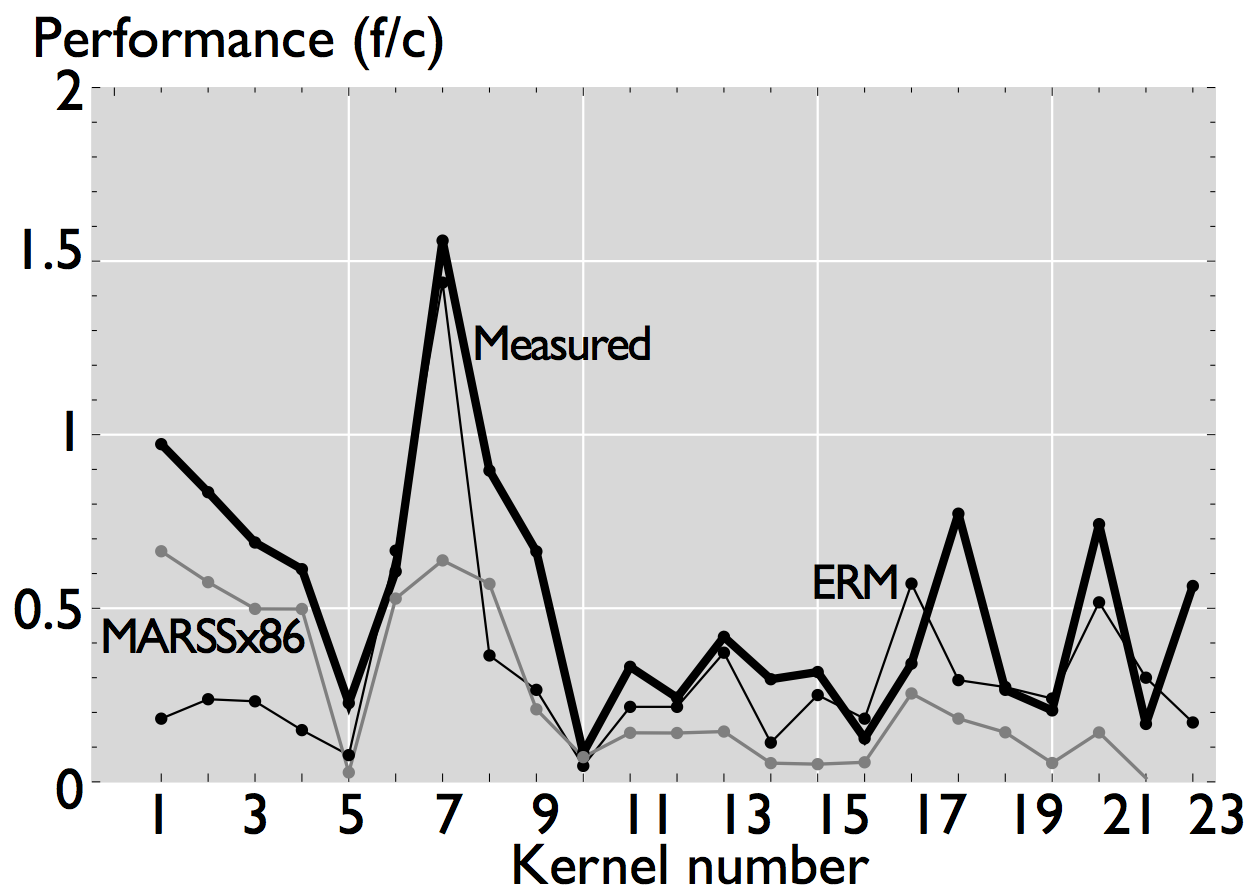
Figure 2: Comparison of performance for the Livermore loops [3], small and large sizes. The plots include the data estimated by MARSSx86 simualtor [2].
In this case, the plots show the normalized performance (ERM performance vs. measured performance) in log scale to properly visualize the fold changes in performance.
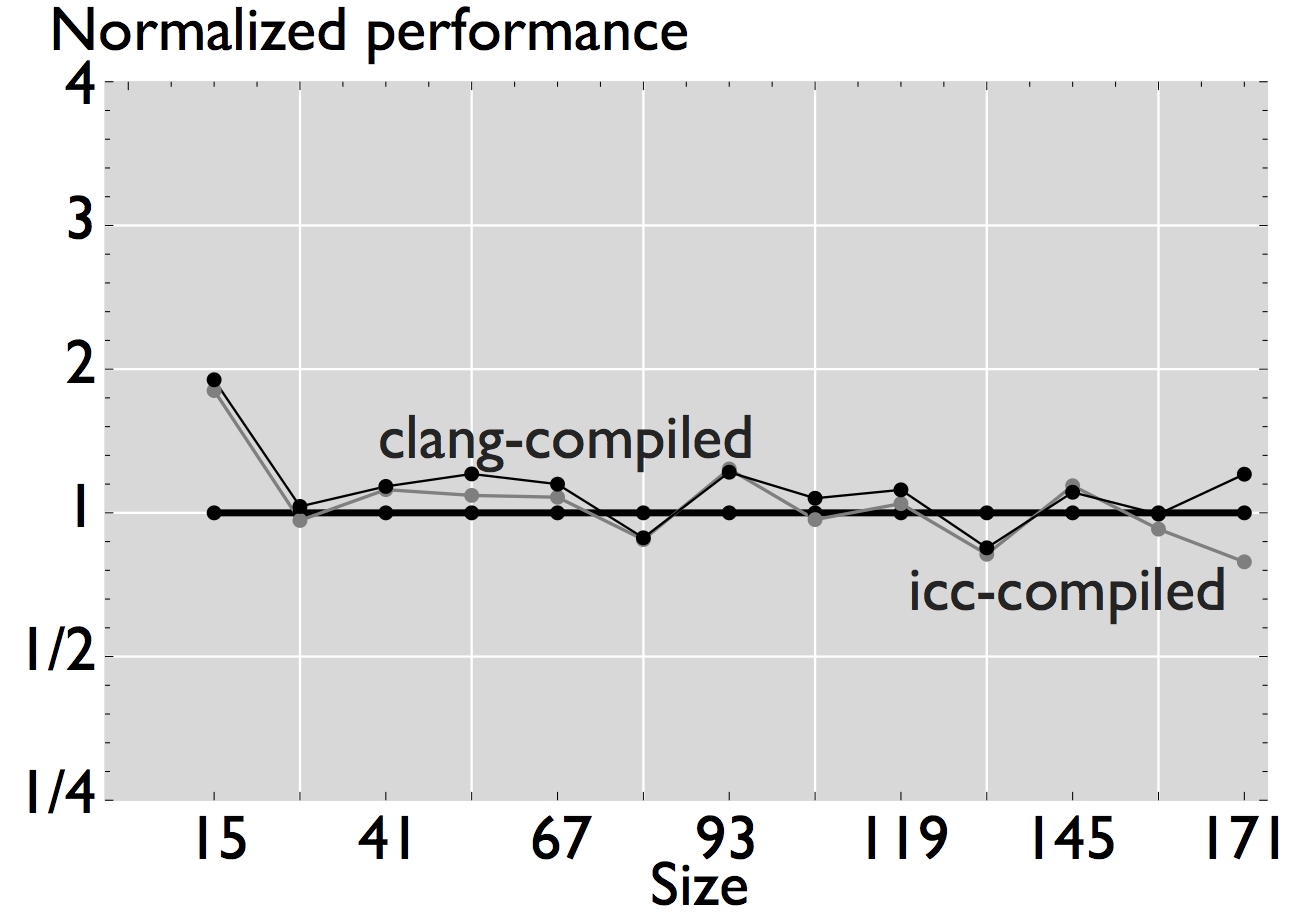
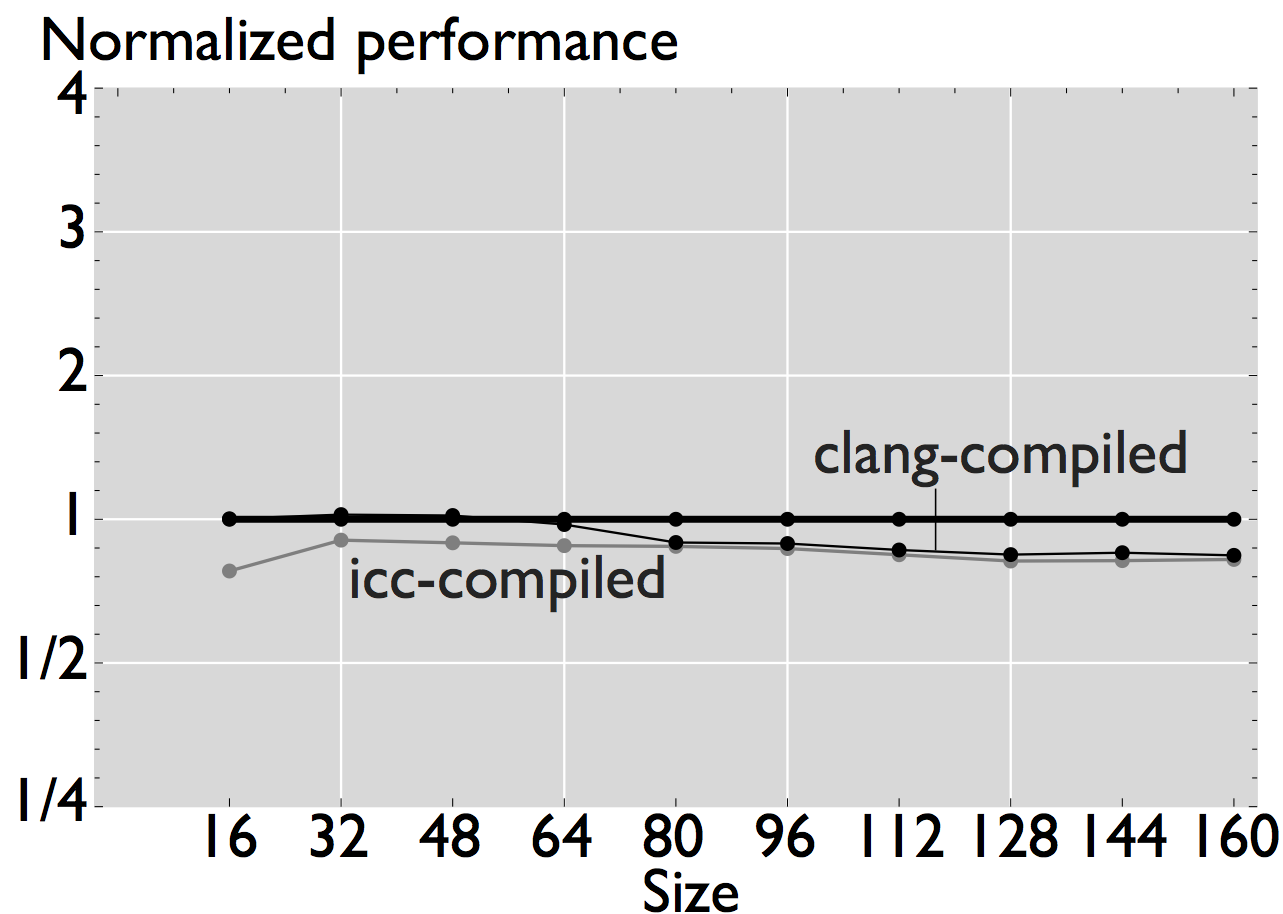
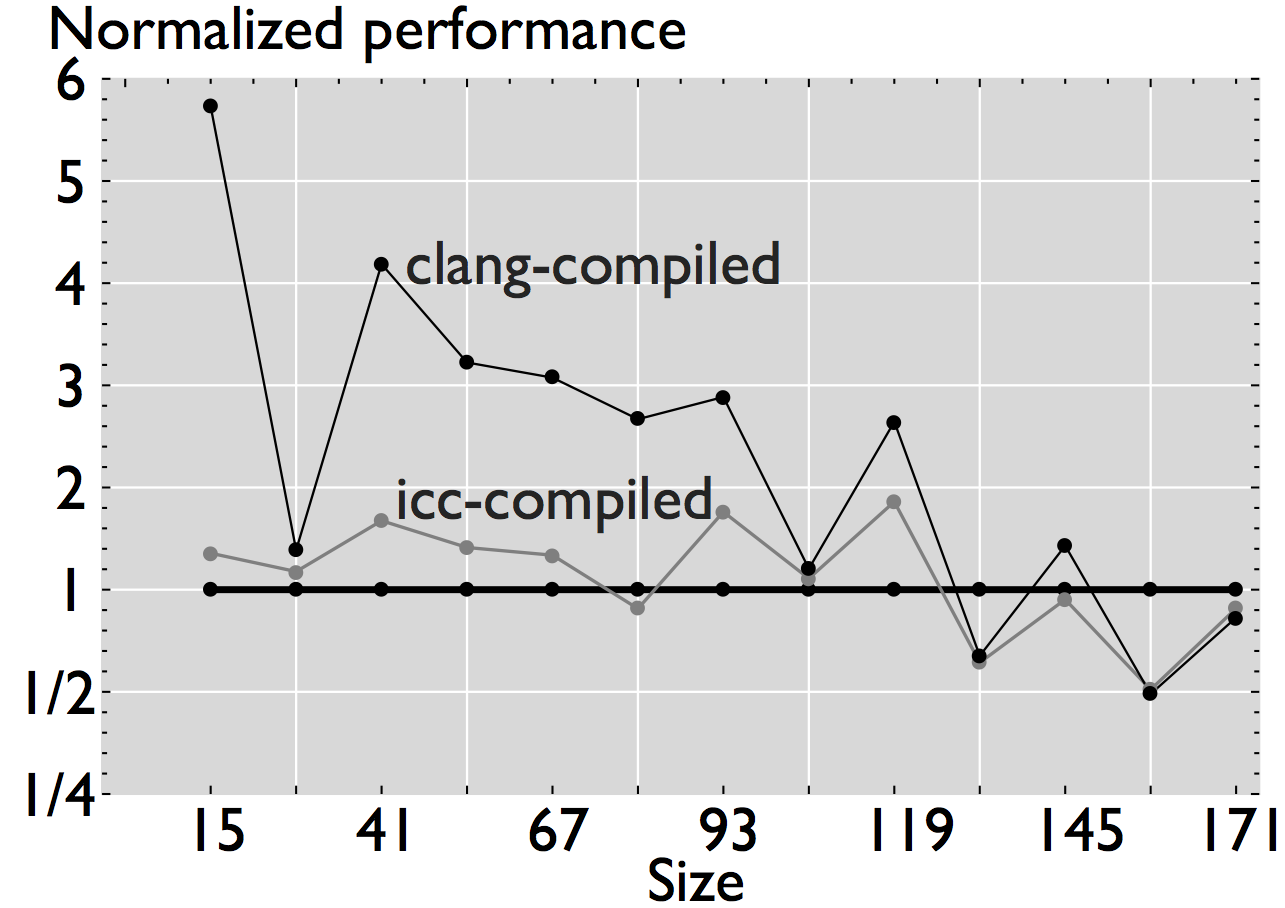
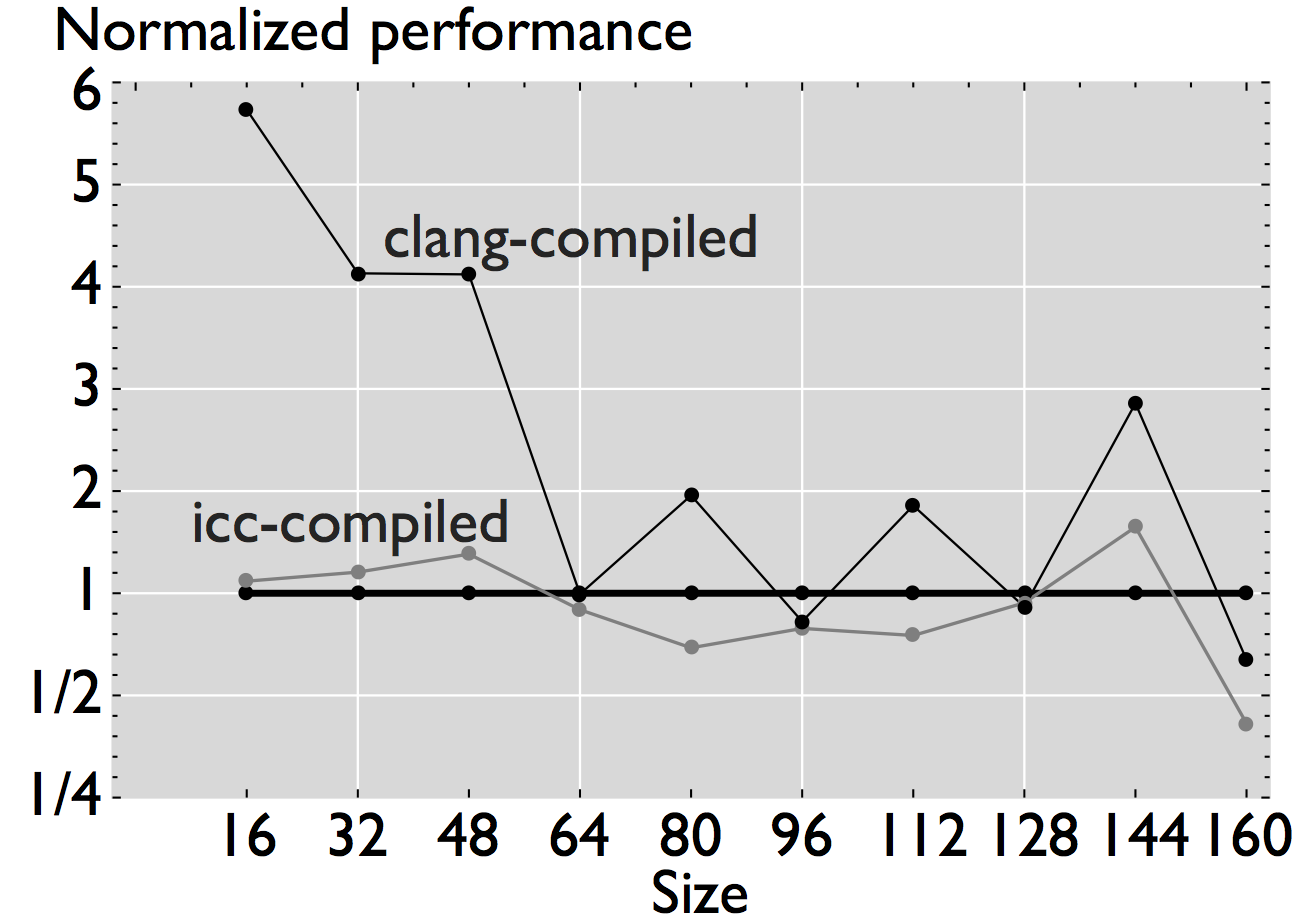
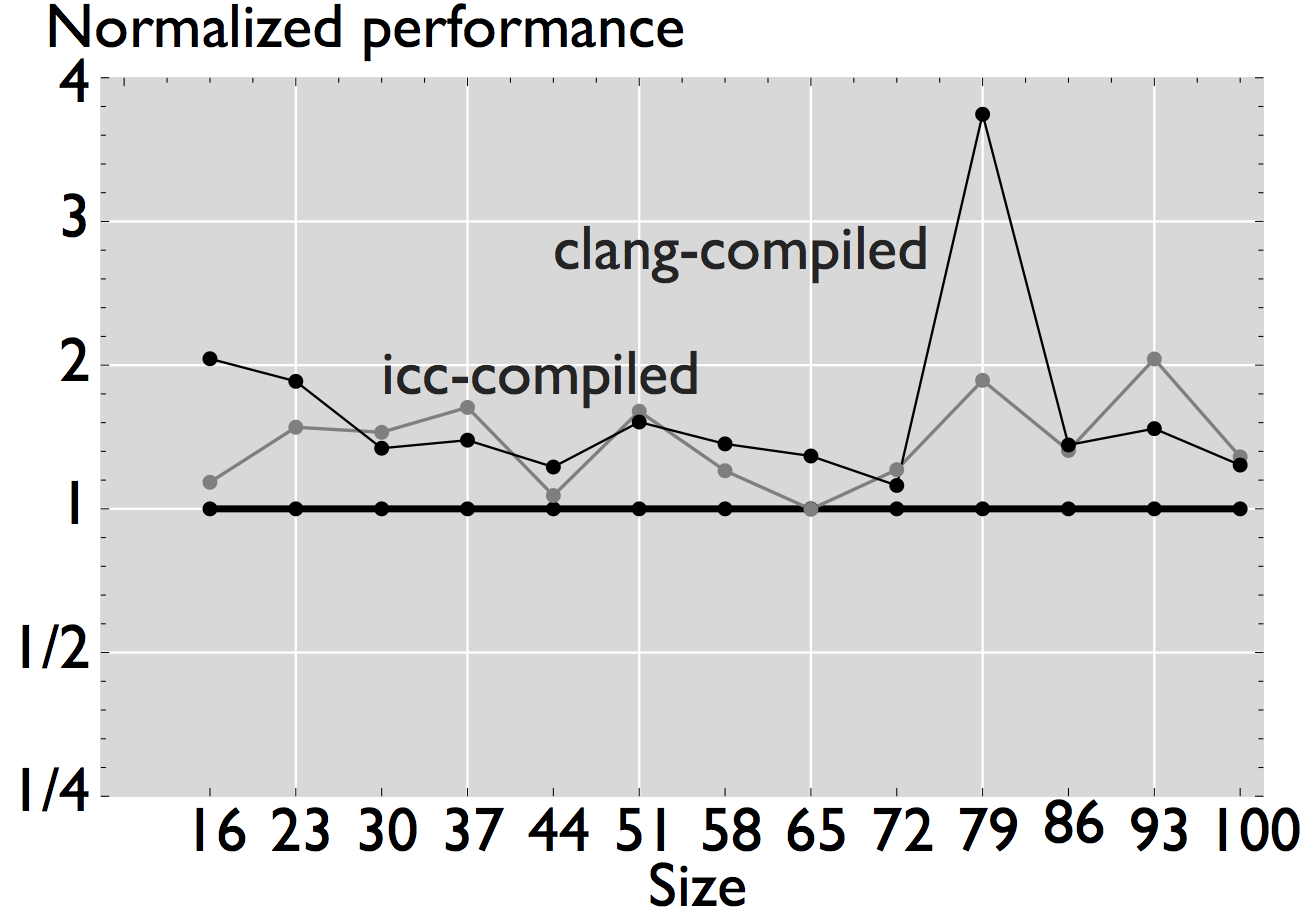
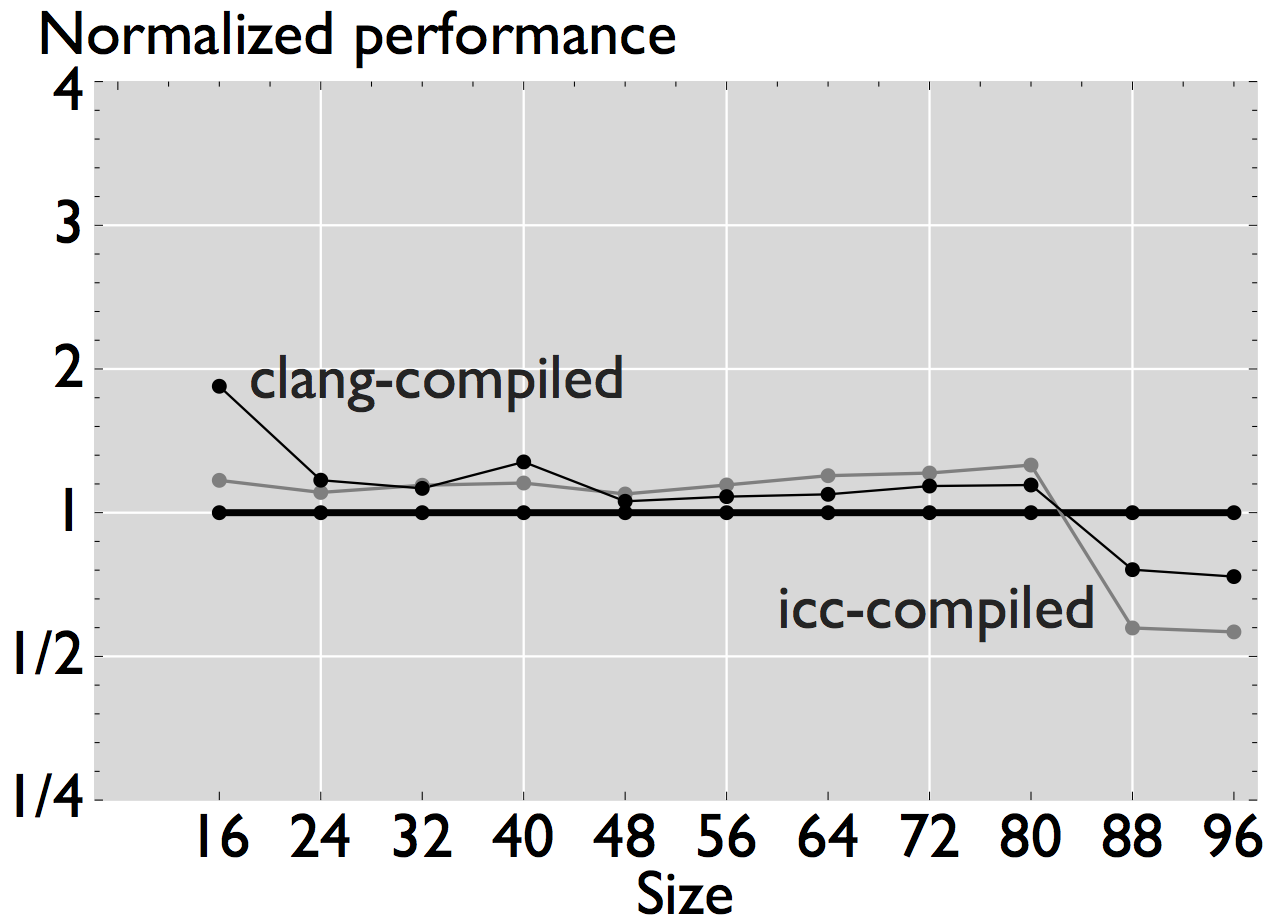
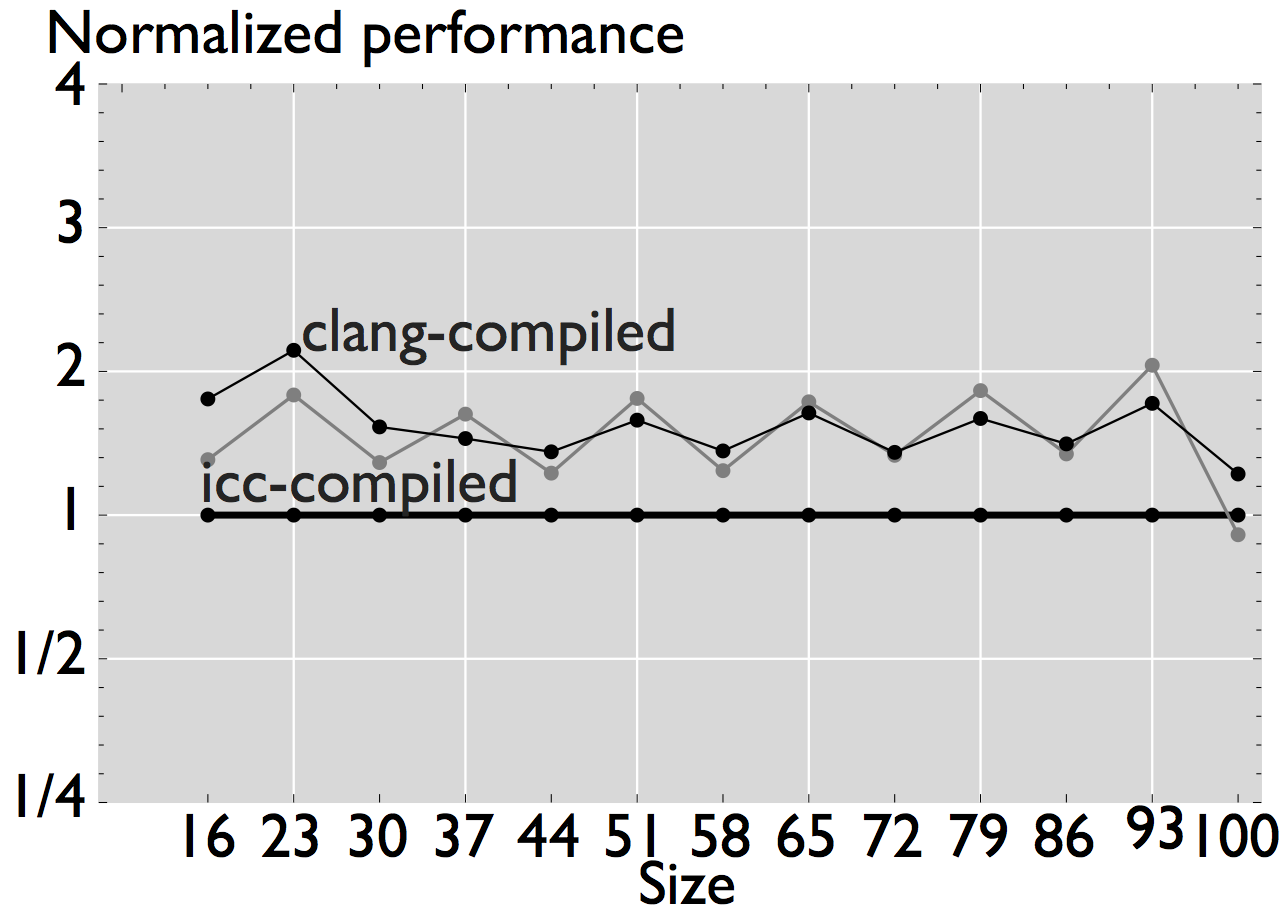
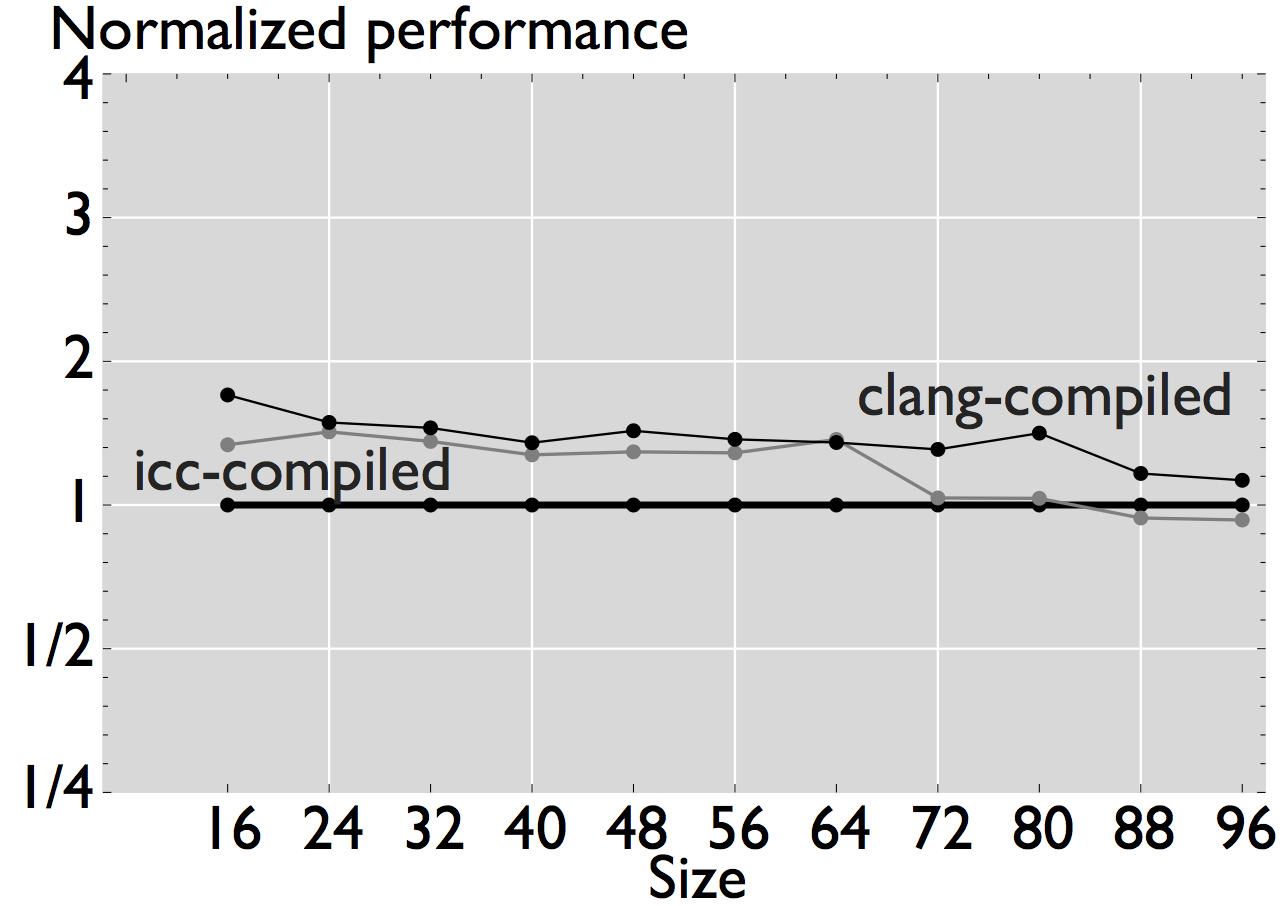
Figure 3: Comparison of performance for four linear algebra subroutines that have been automatically generated and optimized for the target processor [4].
-
Branch prediction. Our model considers a perfect branch predictor and therefore we do not model wrong path fetches due to mispredictions.
-
Cache structure. We model fully-associative caches because their miss rate can be estimated for any cache size with a single-pass analysis of the memory access trace. Not modeling the right cache structure will have effect in applications that exhibit a large number of conflict misses
-
Microop decoding and macroop fusion. The details of how microop decoding and macroop fusion are implemented are not disclosed by processors vendors, and we can only model them based on benchmarking and empirical data [2].
-
Prefetcher. Modern microprocessors implement various kinds of prefetchers. ERM models a generic prefetcher that can be configured with the following parameters: when to trigger the prefetch (e.g., upon a certain number of accesses to consecutive cache blocks), what to prefetch (e.g., the next cache line or a strided access), and where to prefetch (e.g., L1 data or L2 caches). However, since we cannot know precisely which prefetchers are activated when running our experiments, we do not consider them as a parameter in the model.
-
Large sizes. For applications with large sizes, differences in performance tend to be larger due to the complexity of accurately modeling resources like cache structure, memory bandwidth (is affected by many factors in practice like page table loads or write-allocate traffic), and prefetcher.
-
Analysis prior to code generation. ERM analyzes the instruction trace prior to code generation and the effect of target-specific optimizations is not considered by our model.
-
Instructions not analyzed. ERM disregards all computations related to loop index variables, address calculations, or stack pointer arithmetic. The numerical kernels considered by ERM so far, however, are dominated by floating-point computations, and we expect the effects of these instructions to be negligible for most of the kernels.
[1] Intel Performance Counter Monitor. http://software.intel.com/en-us/articles/intel-performance-counter-monitor/.
[3] A. Patel, F. Afram, S. Chen, and K. Ghose, “MARSSx86: A full system simulator for x86 CPUs”, in Proceedings of the Design Automation Conference (DAC), pp. 1050–1055, 2011.
[3] F. H. McMahon, “The livermore fortran kernels: A computer test of the numerical performance range”, 1986.
[4] D. G. Spampinato and M. Püschel, “A basic linear algebra compiler for structured matrices”, in Proceedings of the International Symposium on Code Generation and Optimization (CGO), pp. 117–127, 2016.
[5] “Instruction tables: Lists of instruction latencies, throughputs and micro-operation breakdowns for Intel, AMD and VIA CPUs”, tech. rep., Agner Fog, Technical University of Denmark, 2016.