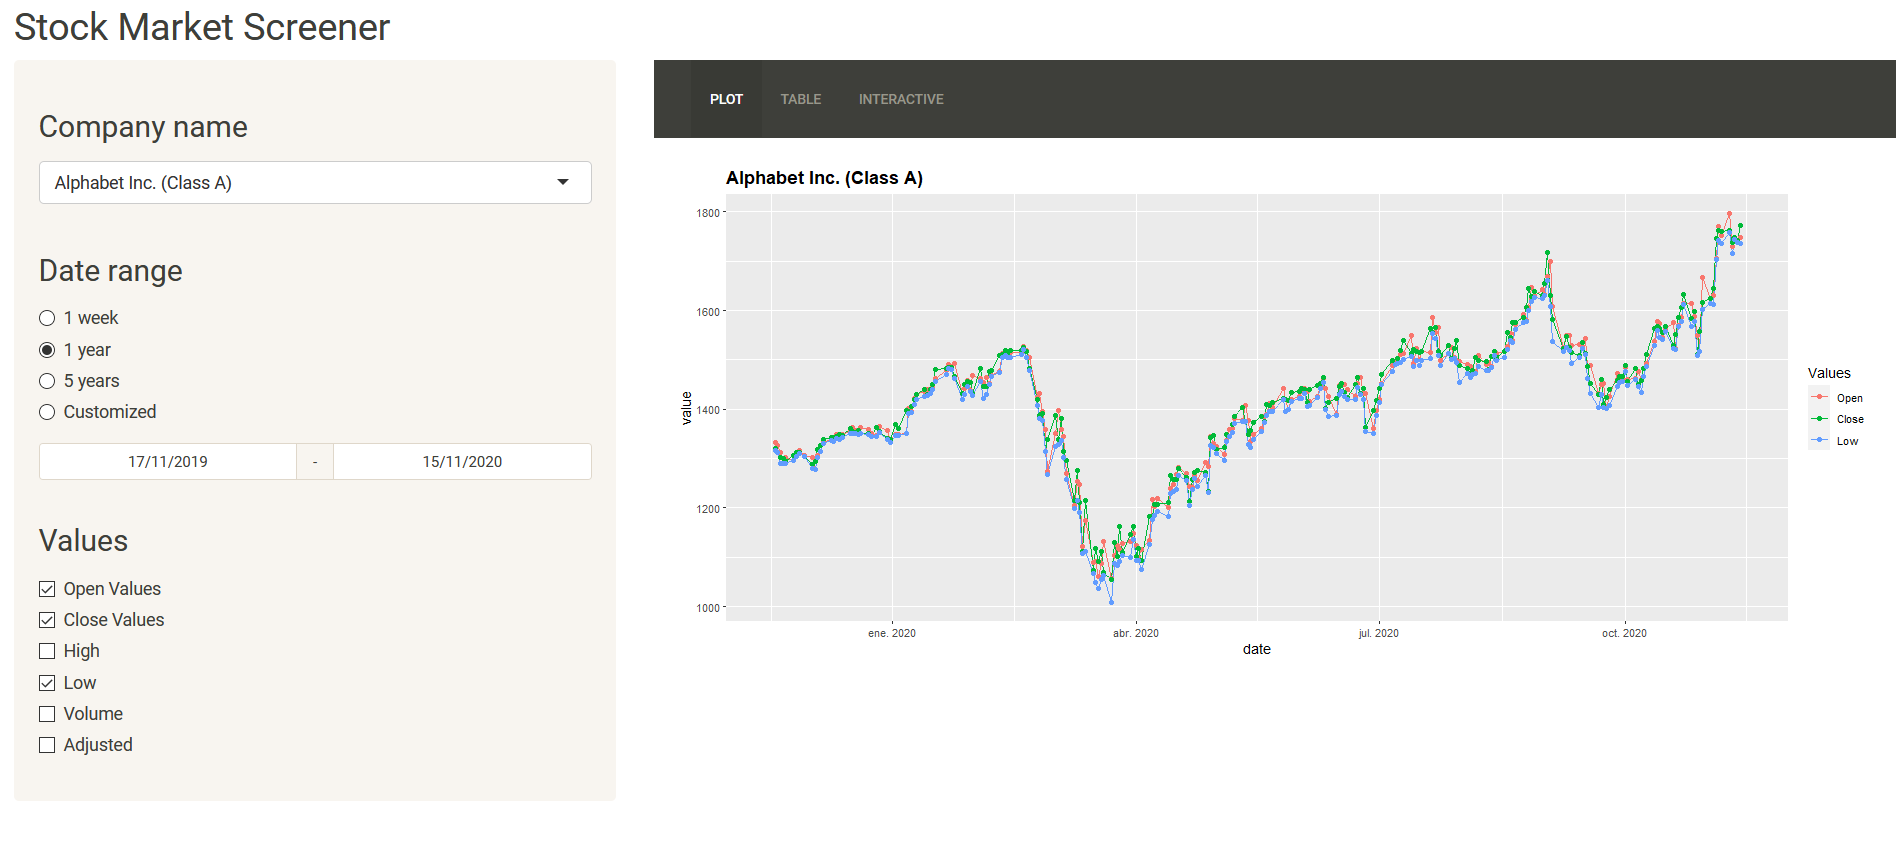
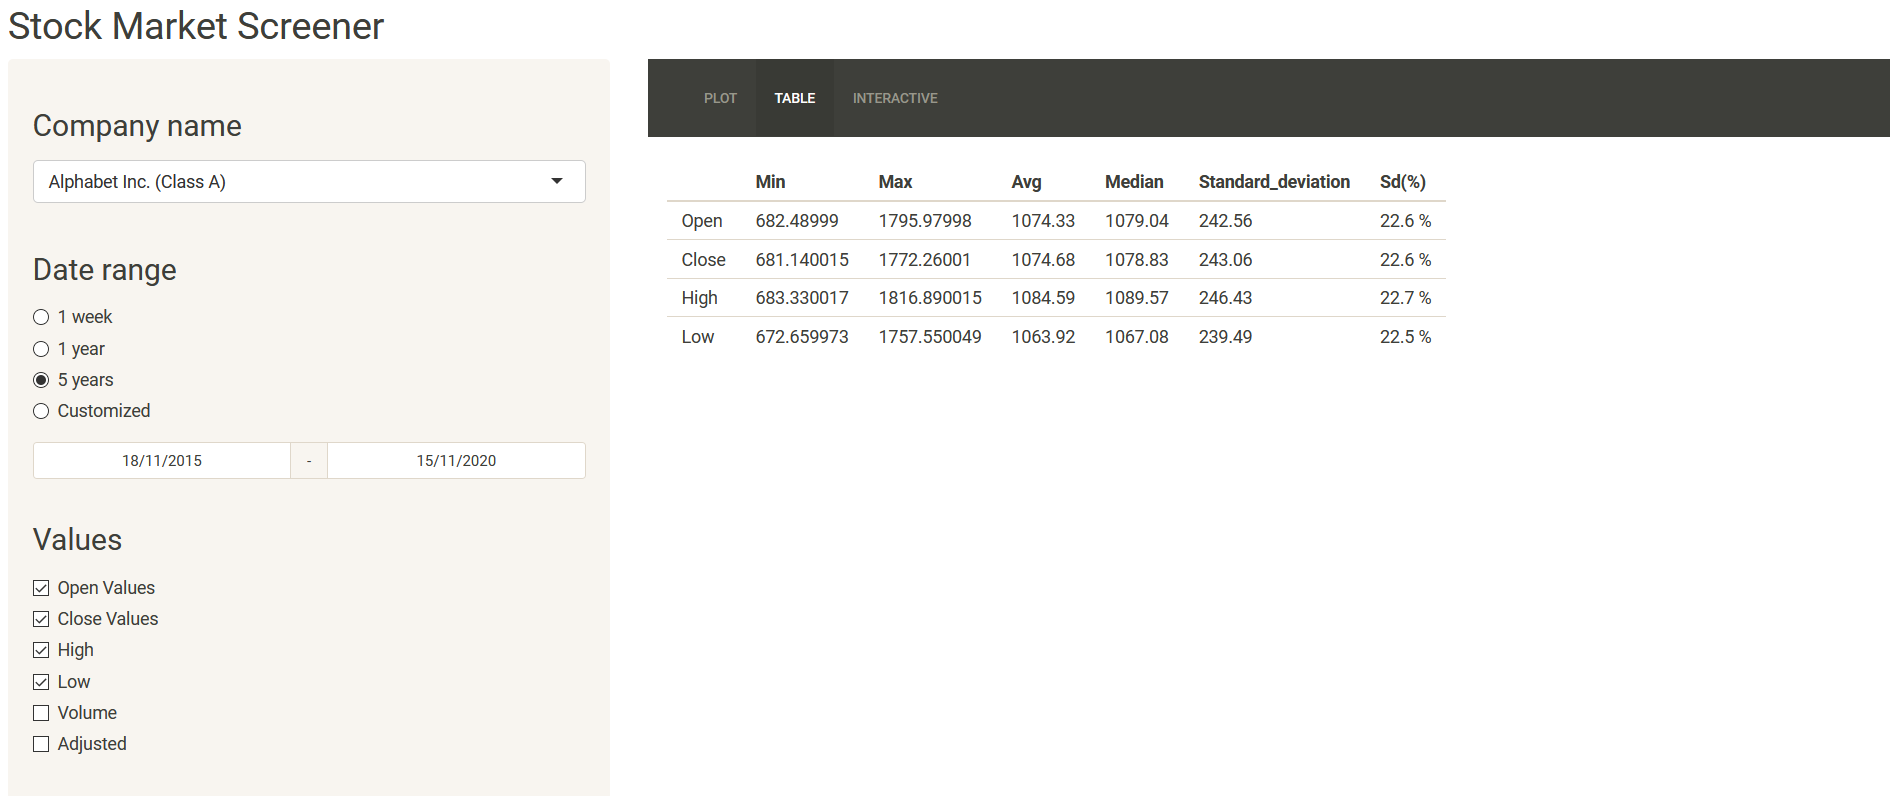
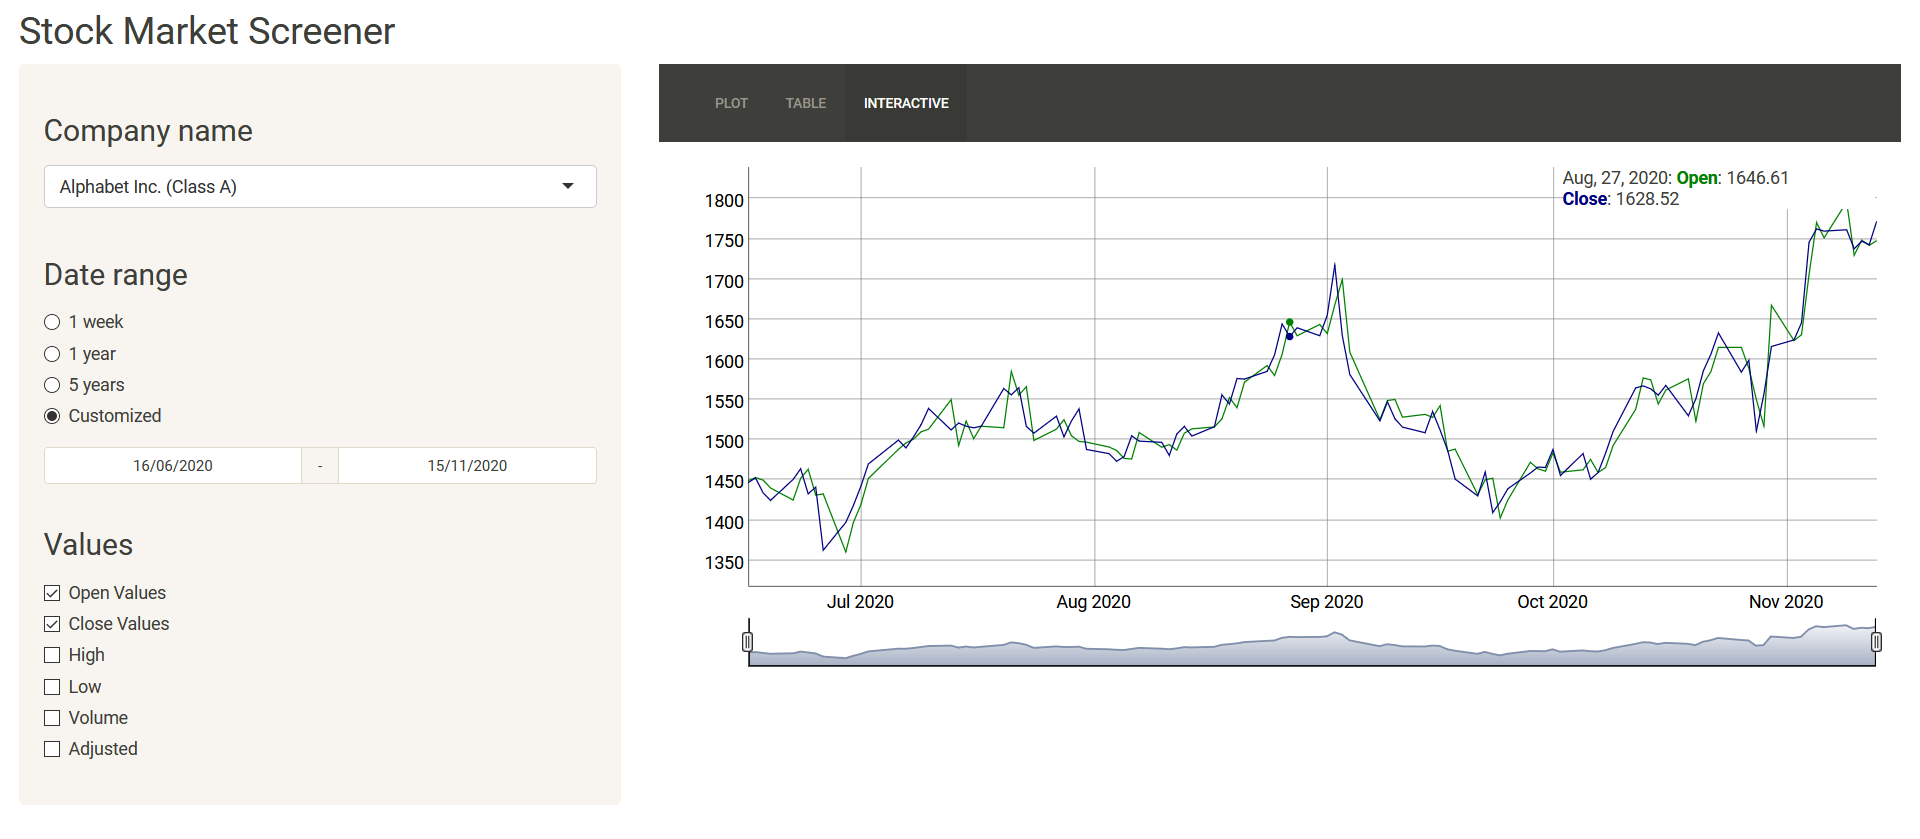
This repository includes the files necessary to build an interface using the R package Shiny to display information of the stock market. It includes the necessary tools to select the company (from the dataset uploaded with over 1890 companies in 50 different countries around the world) and the time period to display.
The first version of this repository allows to see the next values of the stock market for each company during this year:
- Open Values
- Close Values
- High
- Low
- Volume
- Adjusted Value
The interface includes an interactive plot.
The dataset used for this project is:
- stock_market.csv: This file contains information of each company, including:
- Name
- Sector
- Ticker
- Country
For the interface to work it is necessary to install the next packages:
- shiny
- ggplot2
- rtsdata
- reshape
- shinythemes
- dygraphs