- Powers:
-
Dynamic Power: the power comsumed while the inputs are active. While active switching of transistors occurs, meaning the switch of a gate (0 to 1, 1 to 0), the capacitor is charging and discharging. The required energy for the procedure causes the dissipation of the dynamic power. It depends on the capacitance of the transistors, the frequency of switching and the activity level.
-
Leakage : the power consumed while the circuit is inactive is the static power. At this state, leakage of the transistors occurs. Leak- age current depends on the width of the transistors and the local state of the devices. There are two types of leakage, the subthreshold and the gate leakage. Subthreshold leakage is related to the source an drain while the gate leakage is related to current leaking through the gate.
-
By looking at the different defenitions above we can assume that when we run different programs on a procesor only the dynamic power will be affected and not the leakage. This can be explained by the dependencies the two powers have. More specifically, the leakage depends only on the width of the transistor and the state of the circuit, which are not affected by the program, whereas the dynamic power depends on the frequency of switching, which is determined by the program.
Apparently, the duration of the execution does not affect either of the powers above, considering that neither of them have a time dependency.
-
- We have a system with a certain battery capacitance and using two processors with different power consumtions (first 5W and second 50W). The battery life is directly connected to the CPU clock speed. Specifically, higher clock speed results to shorted battery life. Furthermore, a relation between the clock speed and the power consumption also exists. The higher the power consumption is the higher the clock speed.
- So in our case, since the second processor consumes more power, it can't provide longer duration to the battery.
- McPAT only provides information regarding the dynamic and static power of the processor. For this reason we cannot make assumptions regarding the battery life. An auxiliary information from McPAT would be something related to the CPU clock speed.
-
The results provided by McPAT for the processors Xeon and ARM A9 (in this case with print_level 3) are copied in the files Xeon_results.txt and ARM_results.txt respectively.
By reviewing these results we deduce that the Xeon processor cannot be more energy efficient than the ARM A9 since both the dynamic and the static(leakage) power dissipation of Xeon is larger than ARM's processor, as shown below:
Xeon results:
  Peak Power = 134.938 W
  Total Leakage = 36.8319 W
  Peak Dynamic = 98.1063 W
  Subthreshold Leakage = 35.1632 W
  Subthreshold Leakage with power gating = 16.3977 W
  Gate Leakage = 1.66871 W
  Runtime Dynamic = 72.9199 W
ARM A9 results:
  Peak Power = 1.74189 W
  Total Leakage = 0.108687 W
  Peak Dynamic = 1.6332 W
  Subthreshold Leakage = 0.0523094 W
  Gate Leakage = 0.0563774 W
  Runtime Dynamic = 2.96053 W
Also, since the clock speed of Xeon is 50 times higher than ARM A9, as mentioned and explained in the previous section the battery life of Xeon is lower than ARM A9 and consequently Xeon is less energy efficient.
-
Below are presented two results for each benchmark :
- The Energy Consumtion (EC) : EC = (Runtime Dynamic + Subthreshold Leakage + Gate Leakage) * Simulation_Time | core + (Runtime Dynamic + Subthreshold Leakage + Gate Leakage) * Simulation_Time | L2
- The Energy-Delay-Area-Product (EDAP) : EDAP = EC * Area | core + EC * Area | L2
We used the results from core and L2.
Table for EC
| Parameters | specbzip | specmcf | spechmmer | sjeng | speclbm |
|---|---|---|---|---|---|
| x2 cache line size | 0.14914 | 0.0996557 | 0.107665 | - | 0.203184 |
| x2 l1 size and assoc | 0.13976 | 0.119675 | 1.105285 | - | 0.2593412 |
| x2 cache line size and l1 size, assoc and l2 assoc | 0.2082 | 0.1469 | 0.03825 | 0.3661485 | 0.154767 |
| x4 cache line size and x2 l1 size, assoc and l2 assoc | - | - | - | 1.564907 | - |
| x4 cache line size and l2 assoc and x2 l1 size, assoc | - | - | - | 1.563932 | - |
Table for EDAP
| Parameters | specbzip | specmcf | spechmmer | sjeng | speclbm |
|---|---|---|---|---|---|
| x2 cache line size | 1.8645 | 1.2234 | 1.23102 | - | 2.443902 |
| x2 l1 size and assoc | 1.7224 | 4.6243 | 1.29909 | - | 3.188415 |
| x2 cache line size and l1 size, assoc and l2 assoc | 3.7654 | 2.5676 | 0.649438 | 6.3382373 | 2.68664 |
| x4 cache line size and x2 l1 size, assoc and l2 assoc | - | - | - | 89.785626 | - |
| x4 cache line size and l2 assoc and x2 l1 size, assoc | - | - | - | 89.78364 | - |
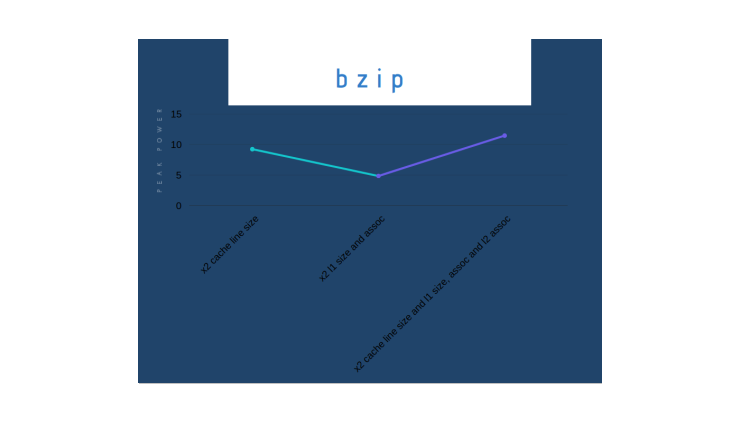
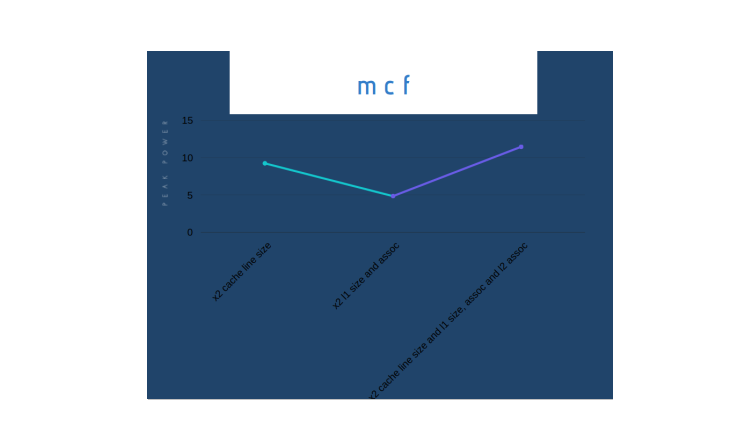
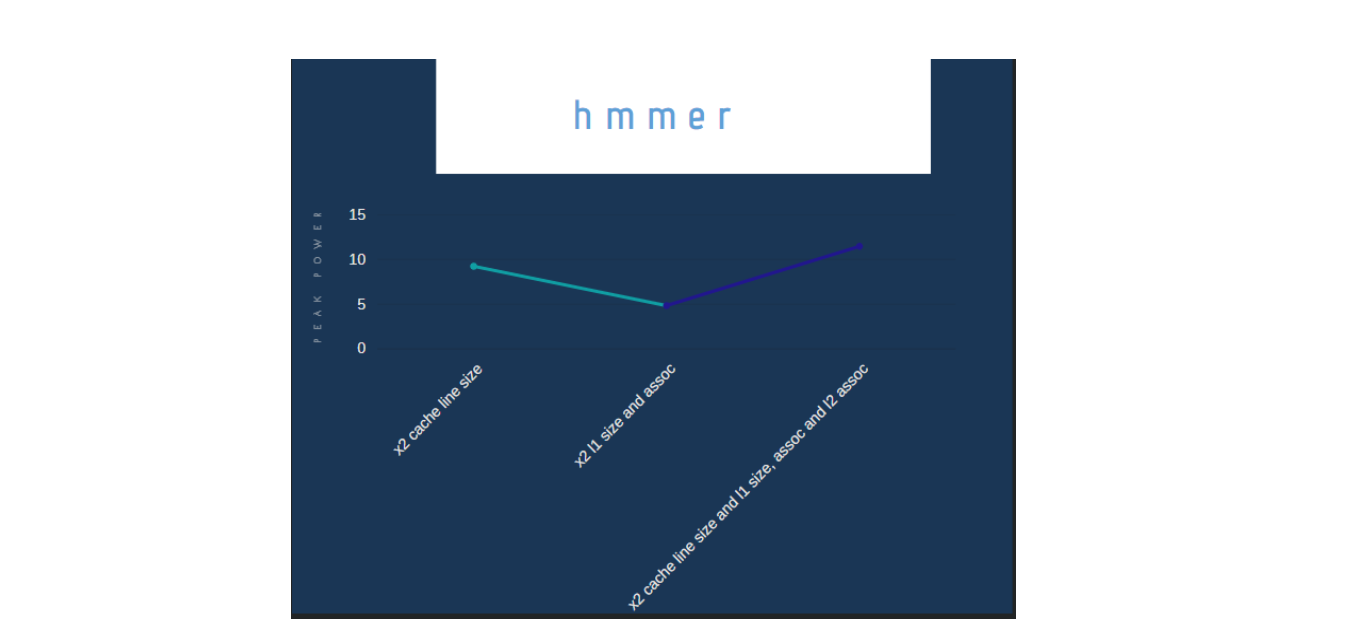
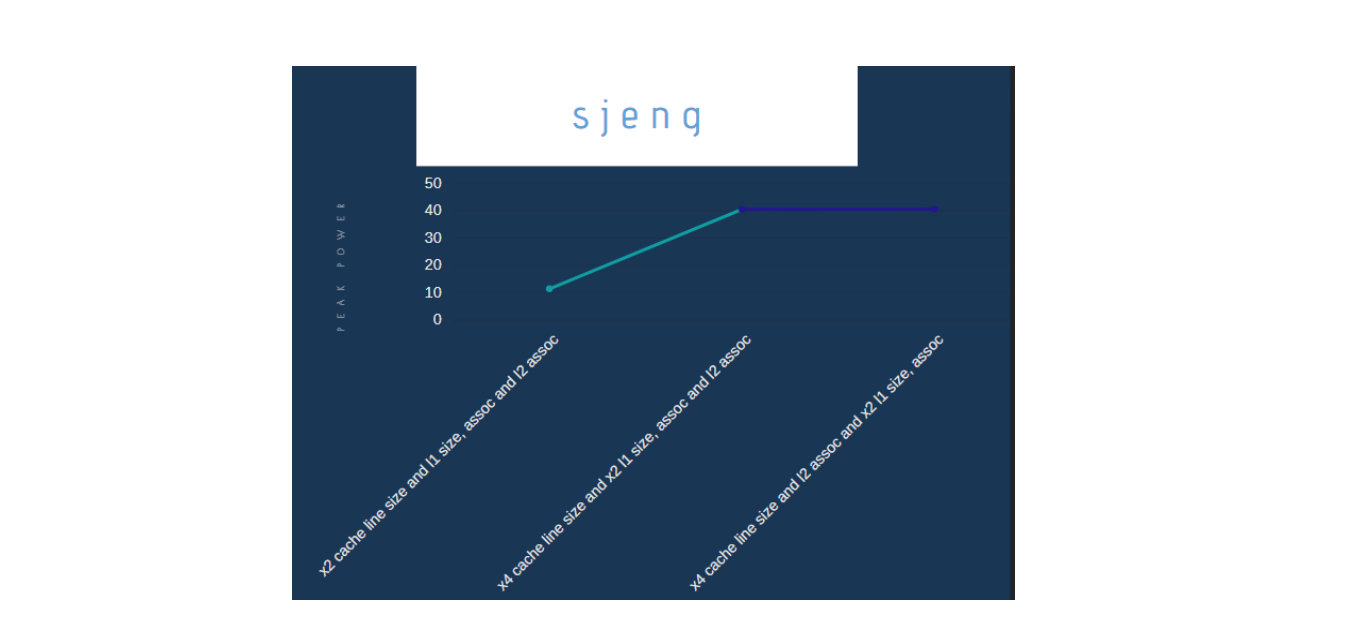
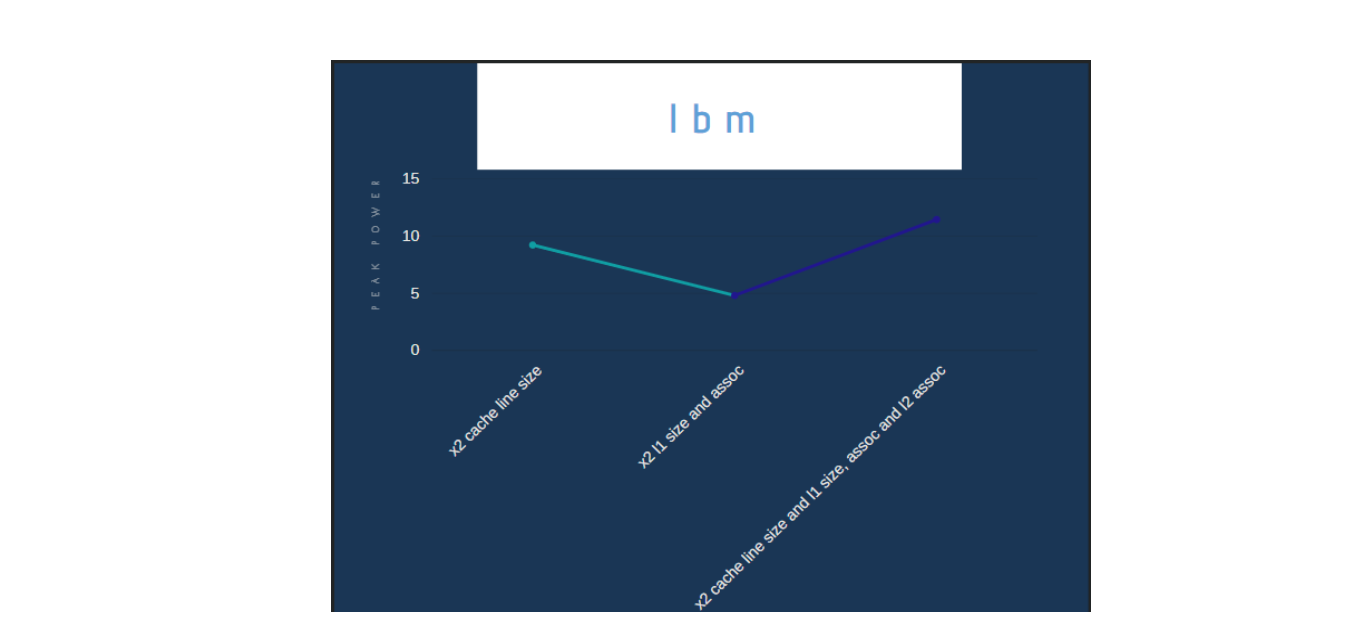
2.The following graphs depict the effect the parameters we changed on the second part of the project have on the power consumption for each benchmark.
Spec_bzip
Spec_mcf
Spec_hmmer
Spec_sjeng
Spec_lbm
- The ideal architecture combines the following features:
- good performance
- low cost
- low power consumption
Based on the results of all three lab exercises we conclude in the following assumptions:
- Lab Exercise 1: Since the power consumption depends on the simulation time, we assume that by simulating for shorter time we can achieve a lower consumption. As mentioned in the Lab Exercise 1, we can decrease the simulation time by using the MinorCPU model instead of the TimingSimpleCPU one. Also the SimpleMemory type contributes to the decreament of the sim_seconds.
- Lab Exercise 2: Based on the majority of the banchmarks, we can achieve the best combination of good performance and low cost by using the following values for the system parameters:
- cache line size = 128
- l1 size = 192 KB (li+ld)
- l1 associativity = 4
- l2 size = 2 MB
- l2 associativity = 16
- Lab Exercise 3: Based on the results from the energy consumption for each change on each benchmark we can see that the more power efficient changes are:
- for bzip and mcf benchmarks:
- cache line size = 128
- l1 size = 96 KB (li+ld)
- l1 associativity = 2
- l2 size = 1 MB
- l2 associativity = 8
- for hmmer, sjeng and lbm benchmarks:
- cache line size = 128
- l1 size = 192 KB (li+ld)
- l1 associativity = 4
- l2 size = 2 MB
- l2 associativity = 16
- for bzip and mcf benchmarks:
So we need to a solution that combines most of the above. We came up with these parameters and values:
- use a
MinorCPUmodel to achieve a short simulation time and reduce the power consumption - use the
SimpleMemorytype to achieve a short simulation time and reduce the power consumption - set the
cache line sizeat 128, since it seems to give positive results in all aspects - for the rest of the system's parameters as shown in Lab Exercise 3 results they differ among the banchmarks. If we take into account the majority of the positive results we can conclude to the following values:
l1 size= 192 KBl1 associativity= 4l2 size= 2 MBl2 associativity= 16
Below are presented some factors that affected the reliability of our results and caused possible mistakes:
- Human mistakes: It's possible that we might have made a few mistakes when we wrote the commands on the terminal or when we tranfered our data.
- Since we are using two programs, if a mistake is commited on gem5, it will be transfered to the second program, as the output of gem5 is the input of McPAT.
- Also, since we are using a script to transfer the necessery data from gem5 to mcpat, if an error occurs in the script it can lead to errors in the mcpat simulation.
- The simulations that occur on gem5 and on McPAT are based on ideal conditions, while running them in real life there may be some outside parameters that we don't take into consideration.
- In the last part when asked to find the best architecture model we selected specific parameters to achive good performance and low cost and consumption. Although the values selected for these parameters contribute in achieving the desired result (either perfrmance or cost or consumption), they might affect negatively the other 2 results.
- When experimenting with simulations we can select and test lots of changes in the system's parameters and observe their affect on the performance, cost and consumption. Although, the simulation range does not seem to have a lot of limitations in terms of the changes that can be apllied, there may be a change that gives better results and can be applied to a real time system but not been tested through a simulation.
- There is also the fallacy that benchmarks remain valid forever. When a simulation is executed, the benchmarks that are used must be up to date with the latest releases and their features comply with the real systems, or else the results will not be in compliance with the ones from actual execution. W e have not confirmed that the benchmarks we used are not abandoned.
- Another mistake that possibly led to unreliable results is the fact that we considered in some cases that the CPI and the clock speed are independent in terms of affecting the overall speed. They are, in fact, affecting the overall speed differently when changed simultaneously than when changed separately.
- Dynamic-static power
- Dynamic power and leakage
- Clock and battery life relation
- Power and clock speed realtion
- Processor power dissipation
- Αρχιτεκτονική Υπολογιστών: Μια ποσοτική προσέγγιση, 6η Αμερικάνικη Έκδοση, John L. Hennessy, David A. Patterson, σελ. 87, πλάνη 2.
- Αρχιτεκτονική Υπολογιστών: Μια ποσοτική προσέγγιση, 6η Αμερικάνικη Έκδοση, John L. Hennessy, David A. Patterson, σελ. 269.